Using the App
The Web Dashboard
The web dashboard is the remote control for the Companion App. Create and control strategies, read your performance, and manage your account from any browser.
The Cloud Dashboard at dashboard.tradelabs.org is the remote control for your Companion App. Open it in any browser to create and edit strategies, start and stop them, and read your performance. Sign in with the account you registered.
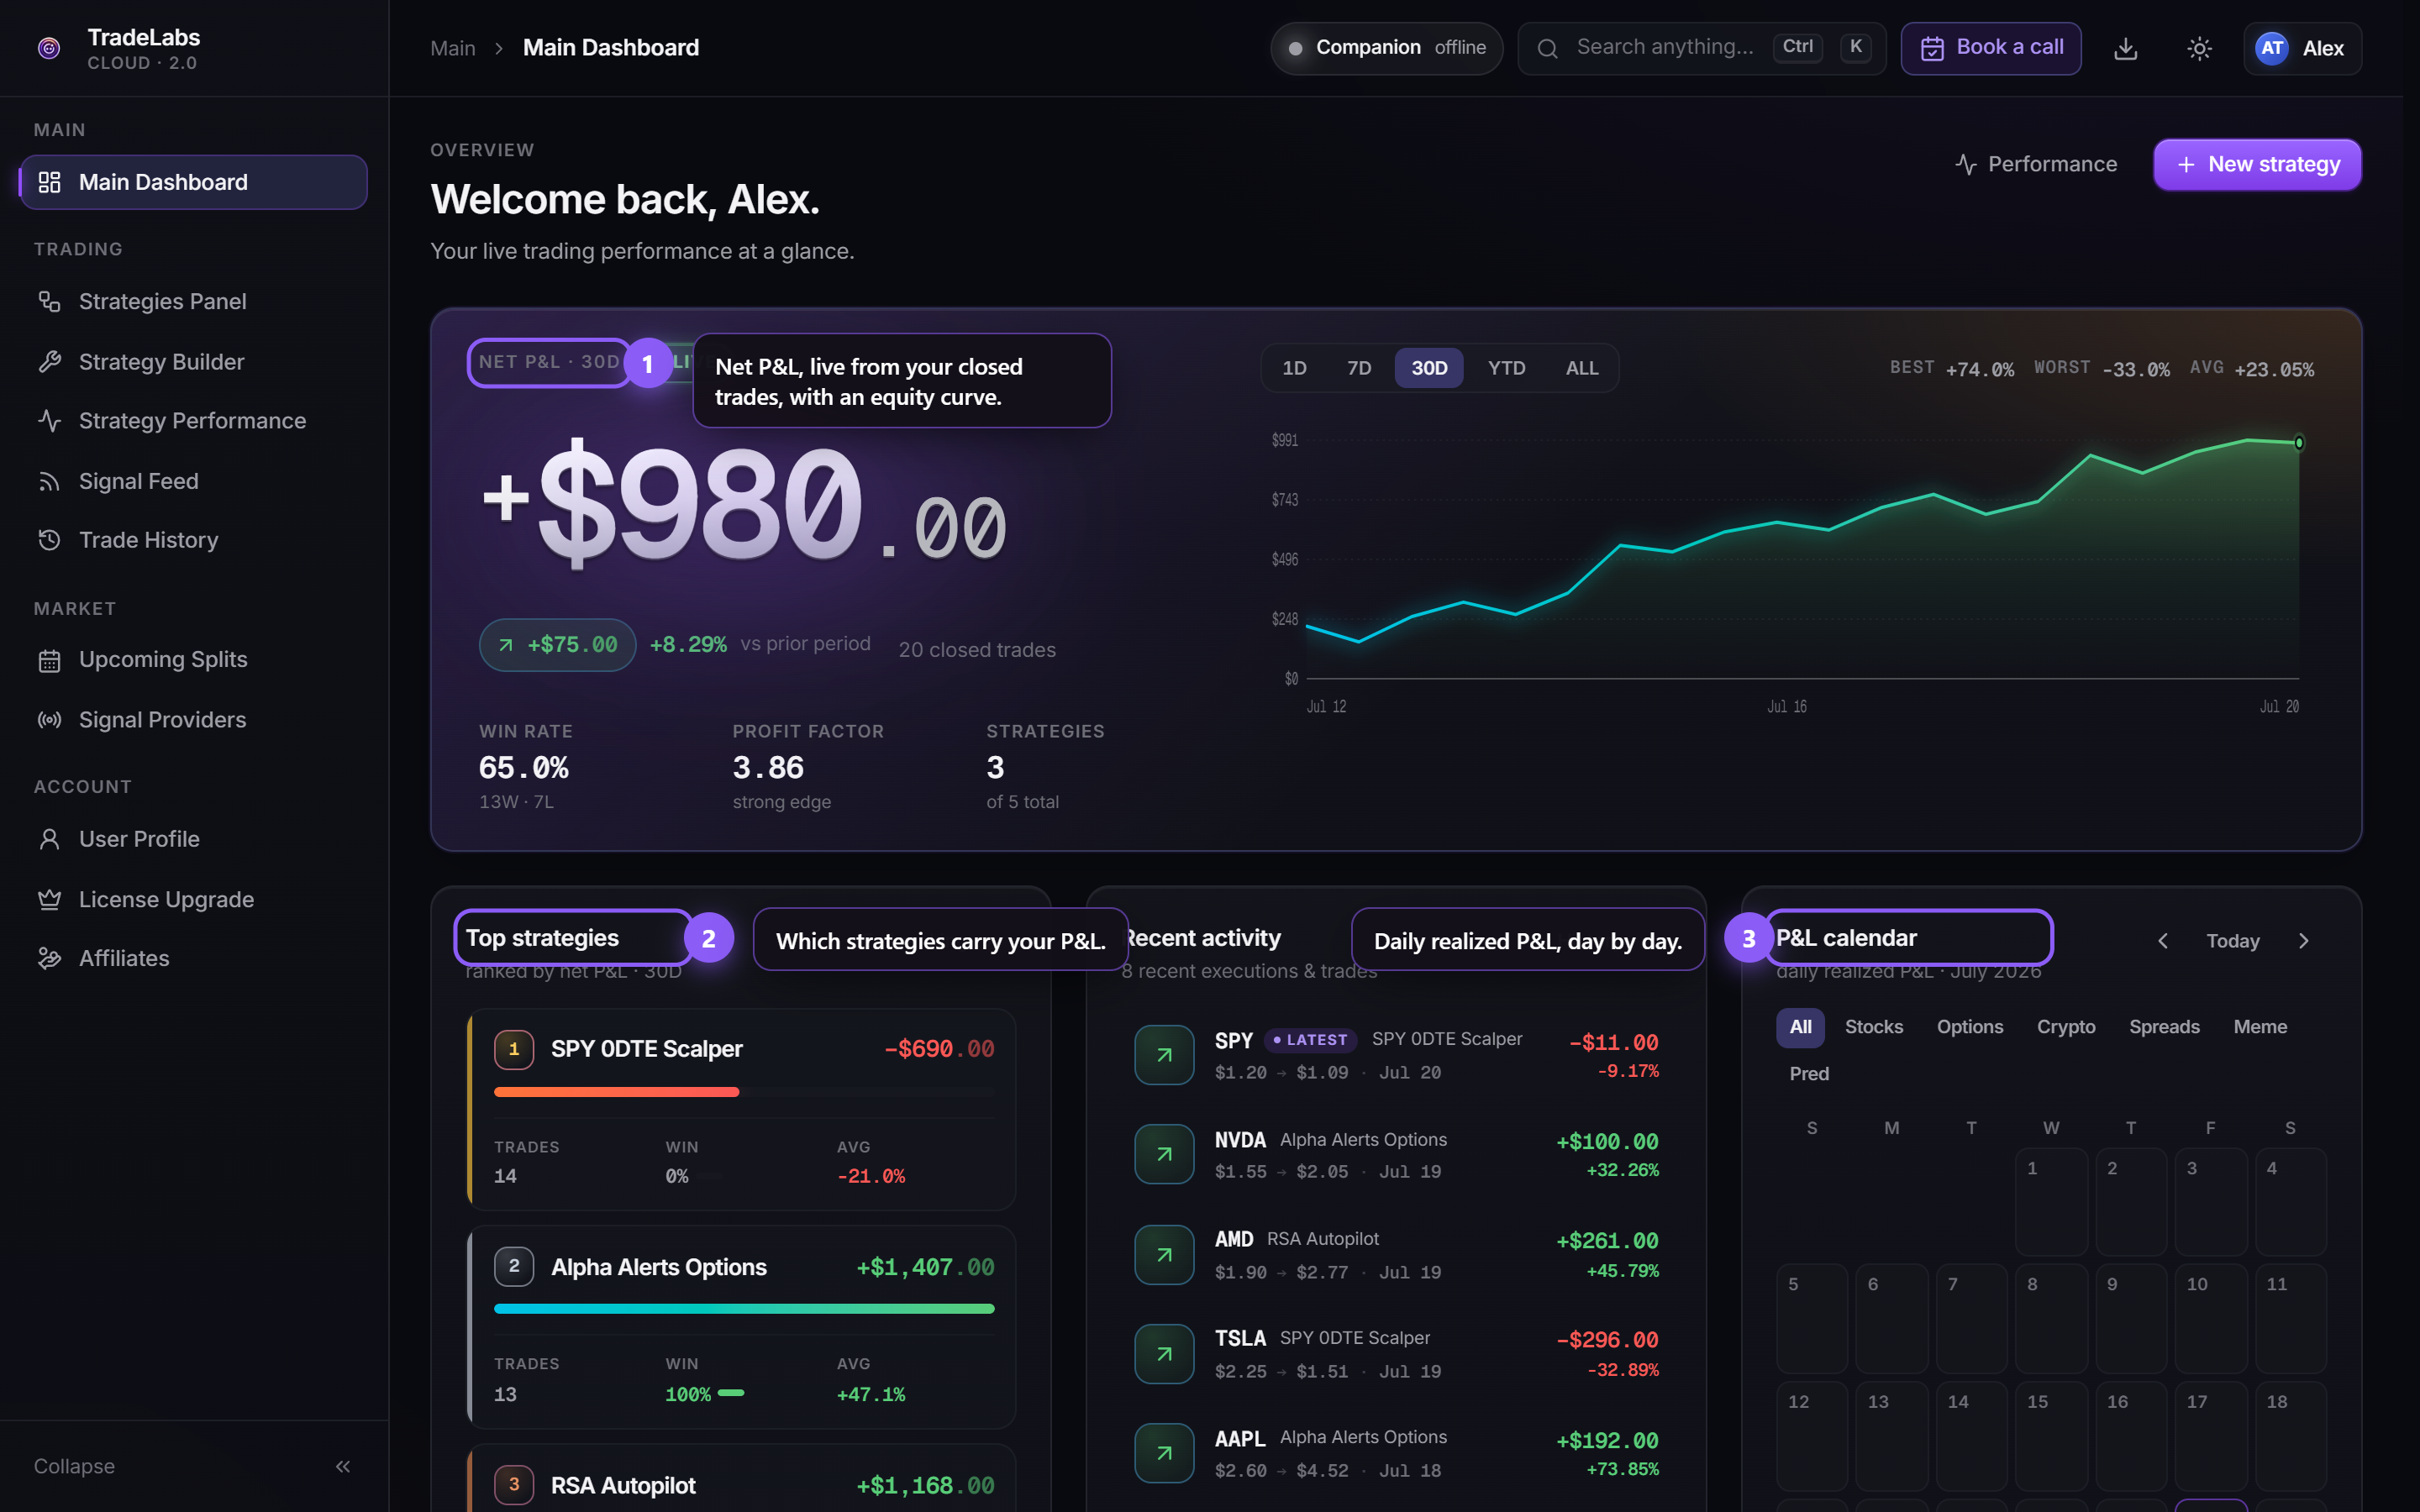 The Main Dashboard: your account at a glance, from any browser.
Remote control
The Companion App on your Windows machine does the work. It connects to your brokers, watches your signals, and places every trade. The dashboard controls that app and reads its results.
Both sides read and write the same cloud storage, so a change in one appears in the other within seconds. There is no manual sync.
- Dashboard to app: strategy config, on/off state.
- App to dashboard: trades, fills, performance.
Nothing trades unless the Companion App is running. The app sends a heartbeat every few seconds. When the heartbeat stops, the dashboard flips to offline and disables every on/off switch. Strategies that were already active stay as they are.
Trade History and the Strategy Builder show a “best on desktop” note on a phone. Both are built around wide tables.
Strategies from the web
The Strategies panel lists every strategy, shows how each is doing, and turns them on and off remotely.
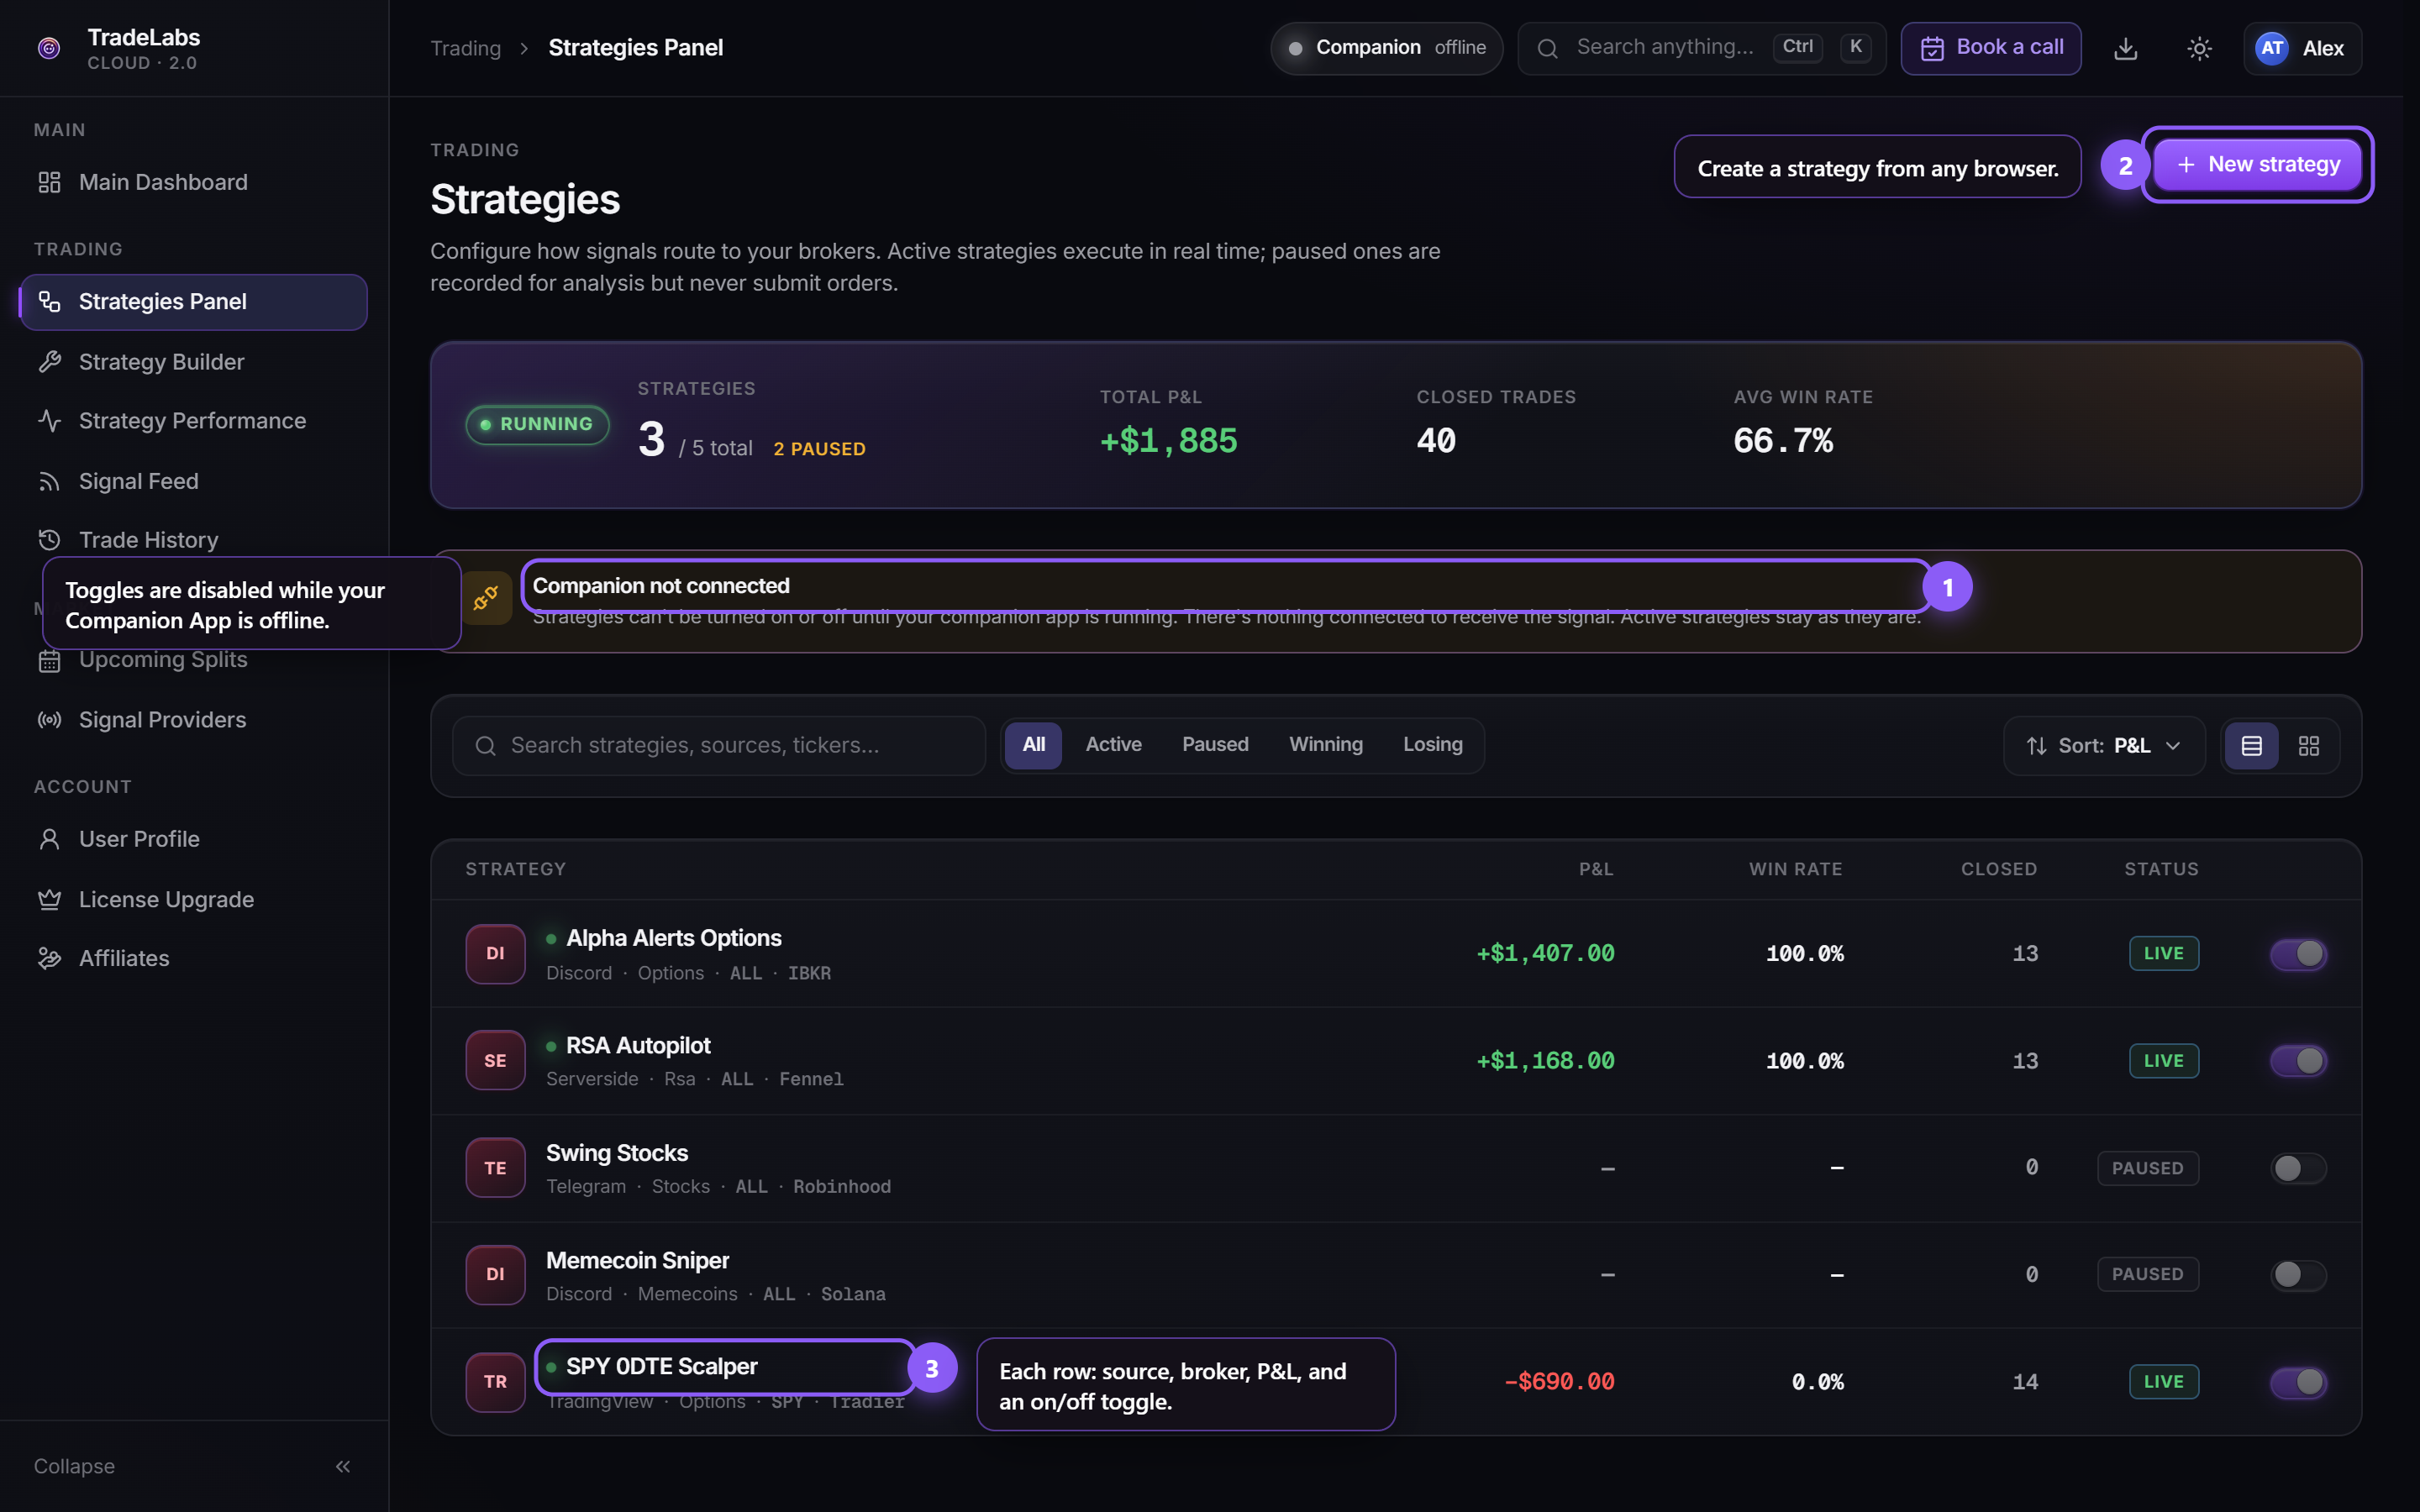 The Strategies panel. The amber notice means your Companion App is offline, so the toggles are locked.
An aggregate bar reads the whole account: strategies running, combined P&L, closed trades, average win rate. Below it sit search (name, source, ticker), filters (All, Active, Paused, Winning, Losing), sort (P&L, Name, Most recent, Trades, Win rate), and a list/grid toggle.
Each row carries the name and a source chip, the source, instrument, ticker and broker, P&L, win rate, closed trades, a Live or Paused pill, and a toggle. A new strategy shows a dash until its first closed trade.
On executes signals in real time. Off keeps the strategy for analysis but never submits an order.
- Create. New strategy opens a template gallery. Pick a template, or start from scratch.
- Edit. Click a row for a drawer: a P&L hero, the full configuration, Pause and Resume, Edit strategy, and a Danger zone to delete. Deleting is permanent and leaves your trade history intact.
- Build. Three columns: a section rail, the form, and a live preview that says in plain English what the strategy will do. Templates appear while creating, never while editing, so a stray tap cannot wipe a saved strategy. Save is explicit.
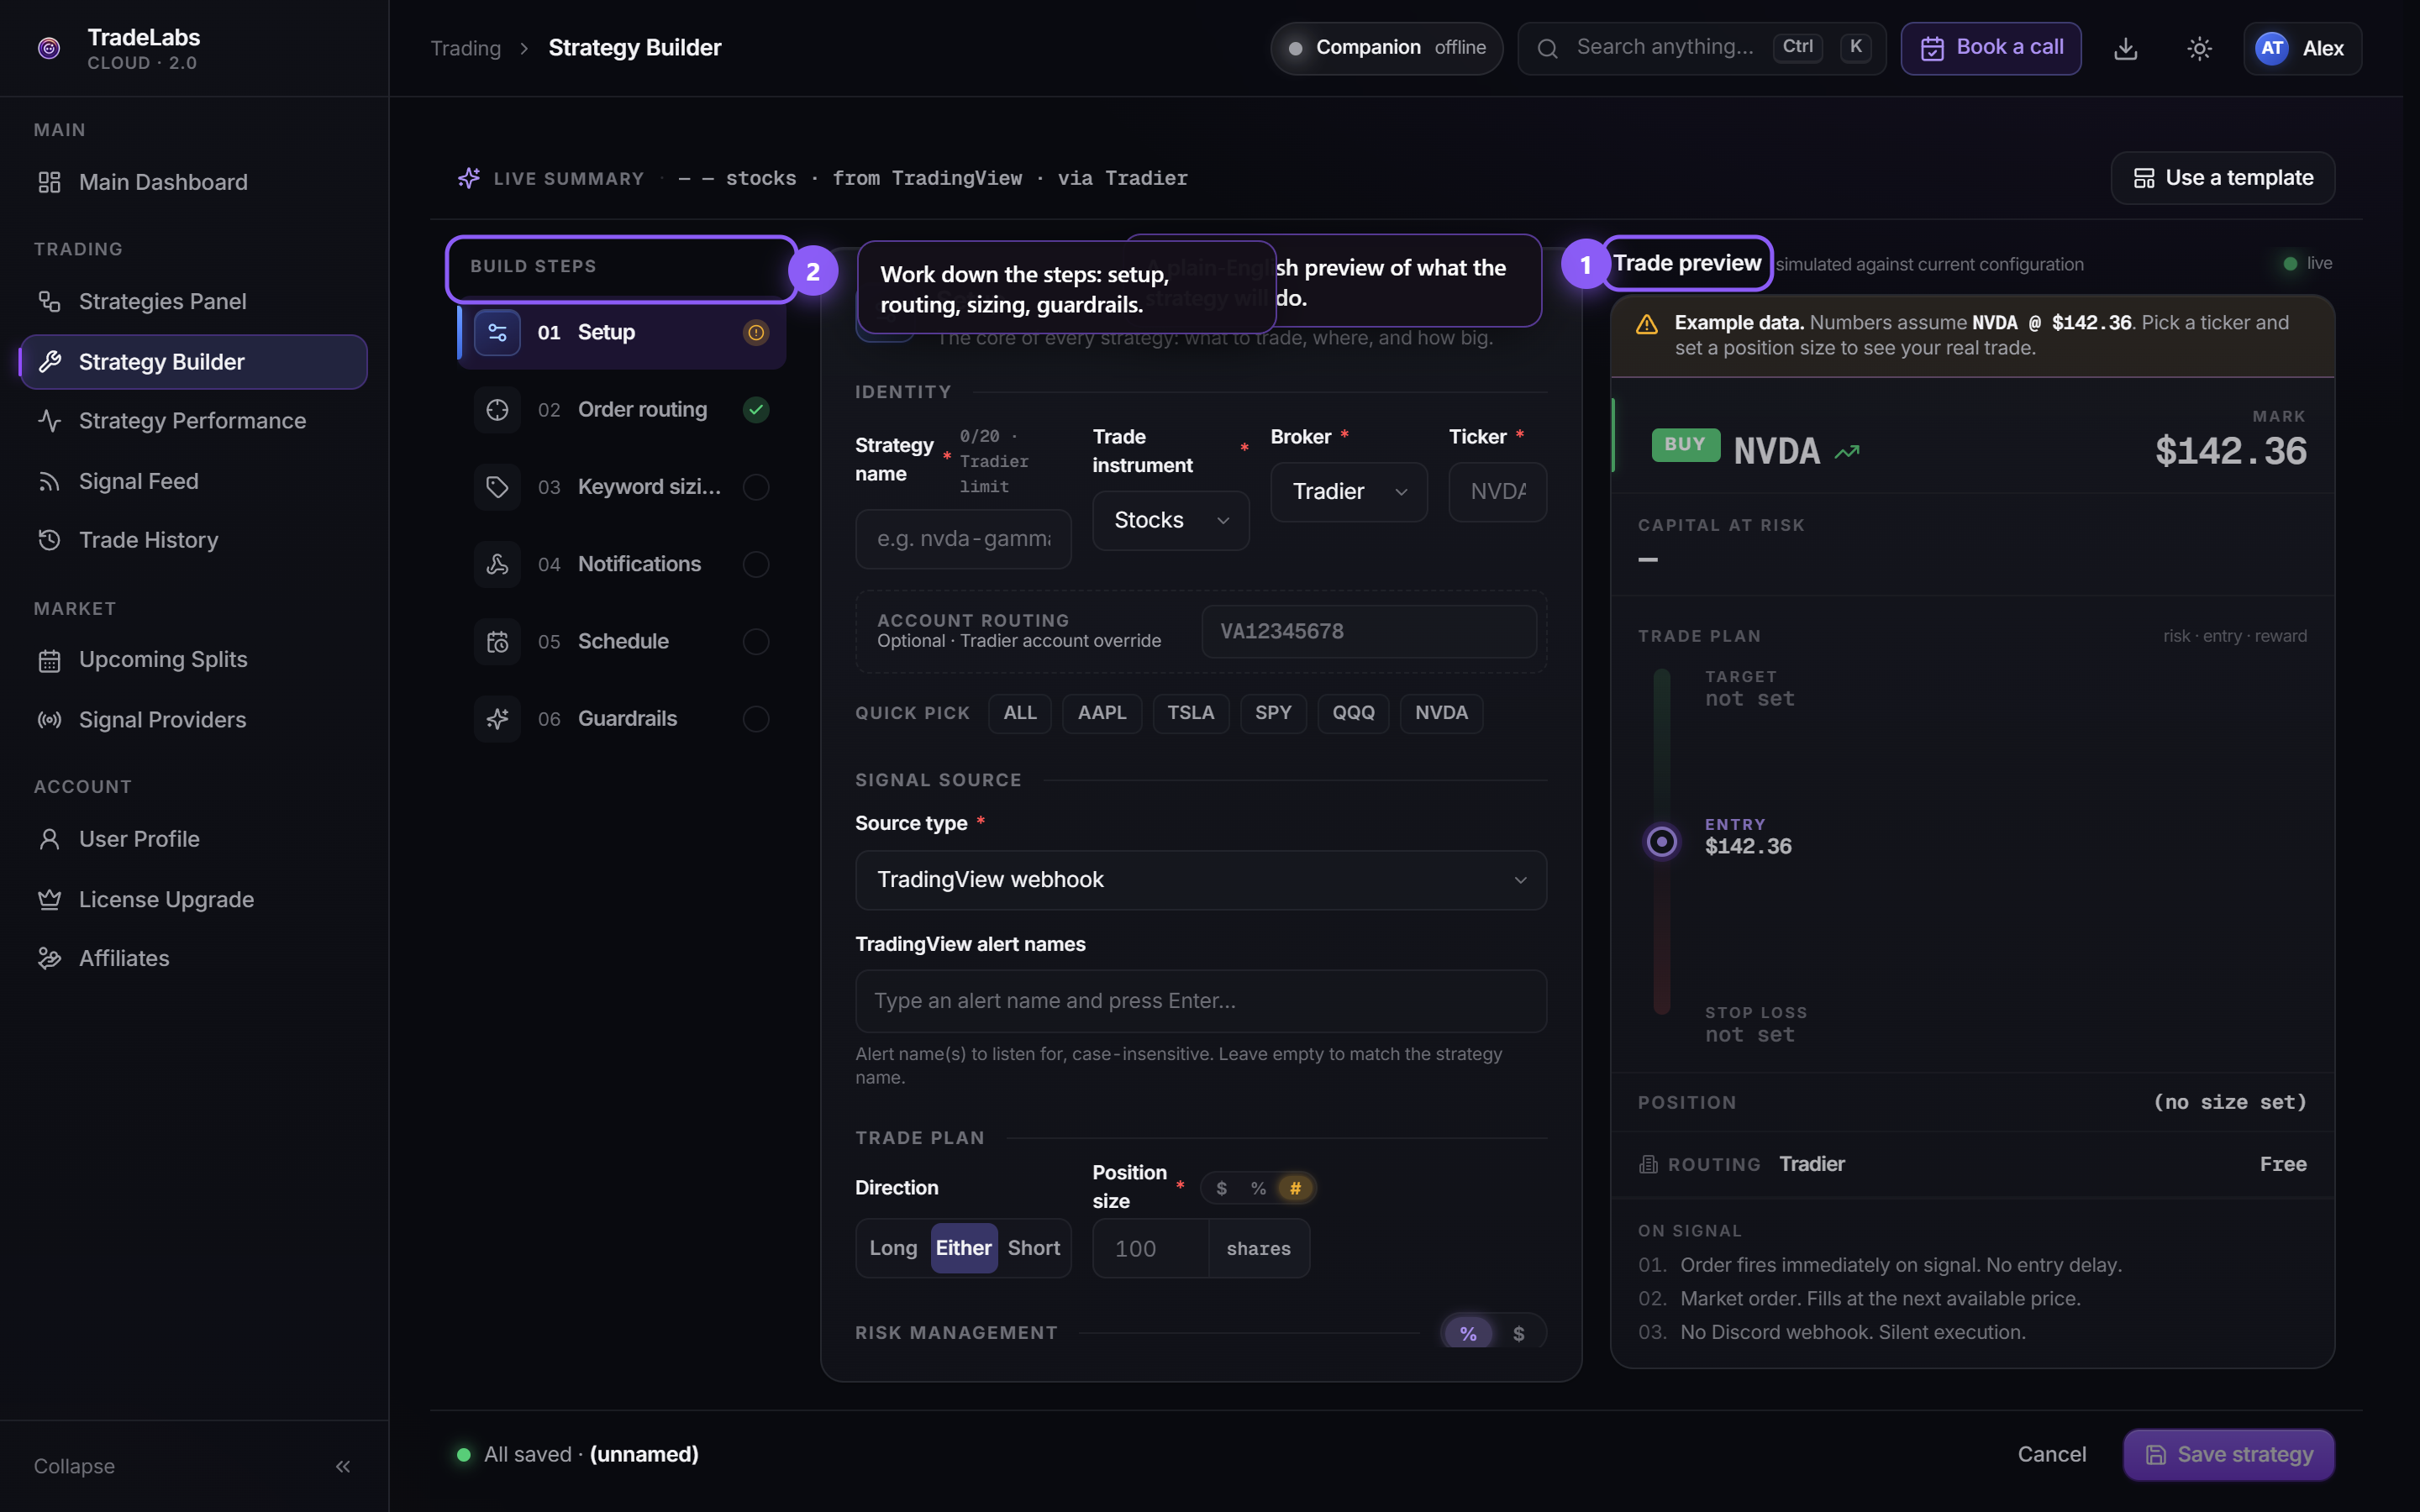 The Strategy Builder. The right column previews what the strategy will do.
Performance & PnL
Two read-only pages, both built from closed trades only. An open position has no final result, so it does not count until it closes. Your first visit indexes your history once. Later visits are instant.
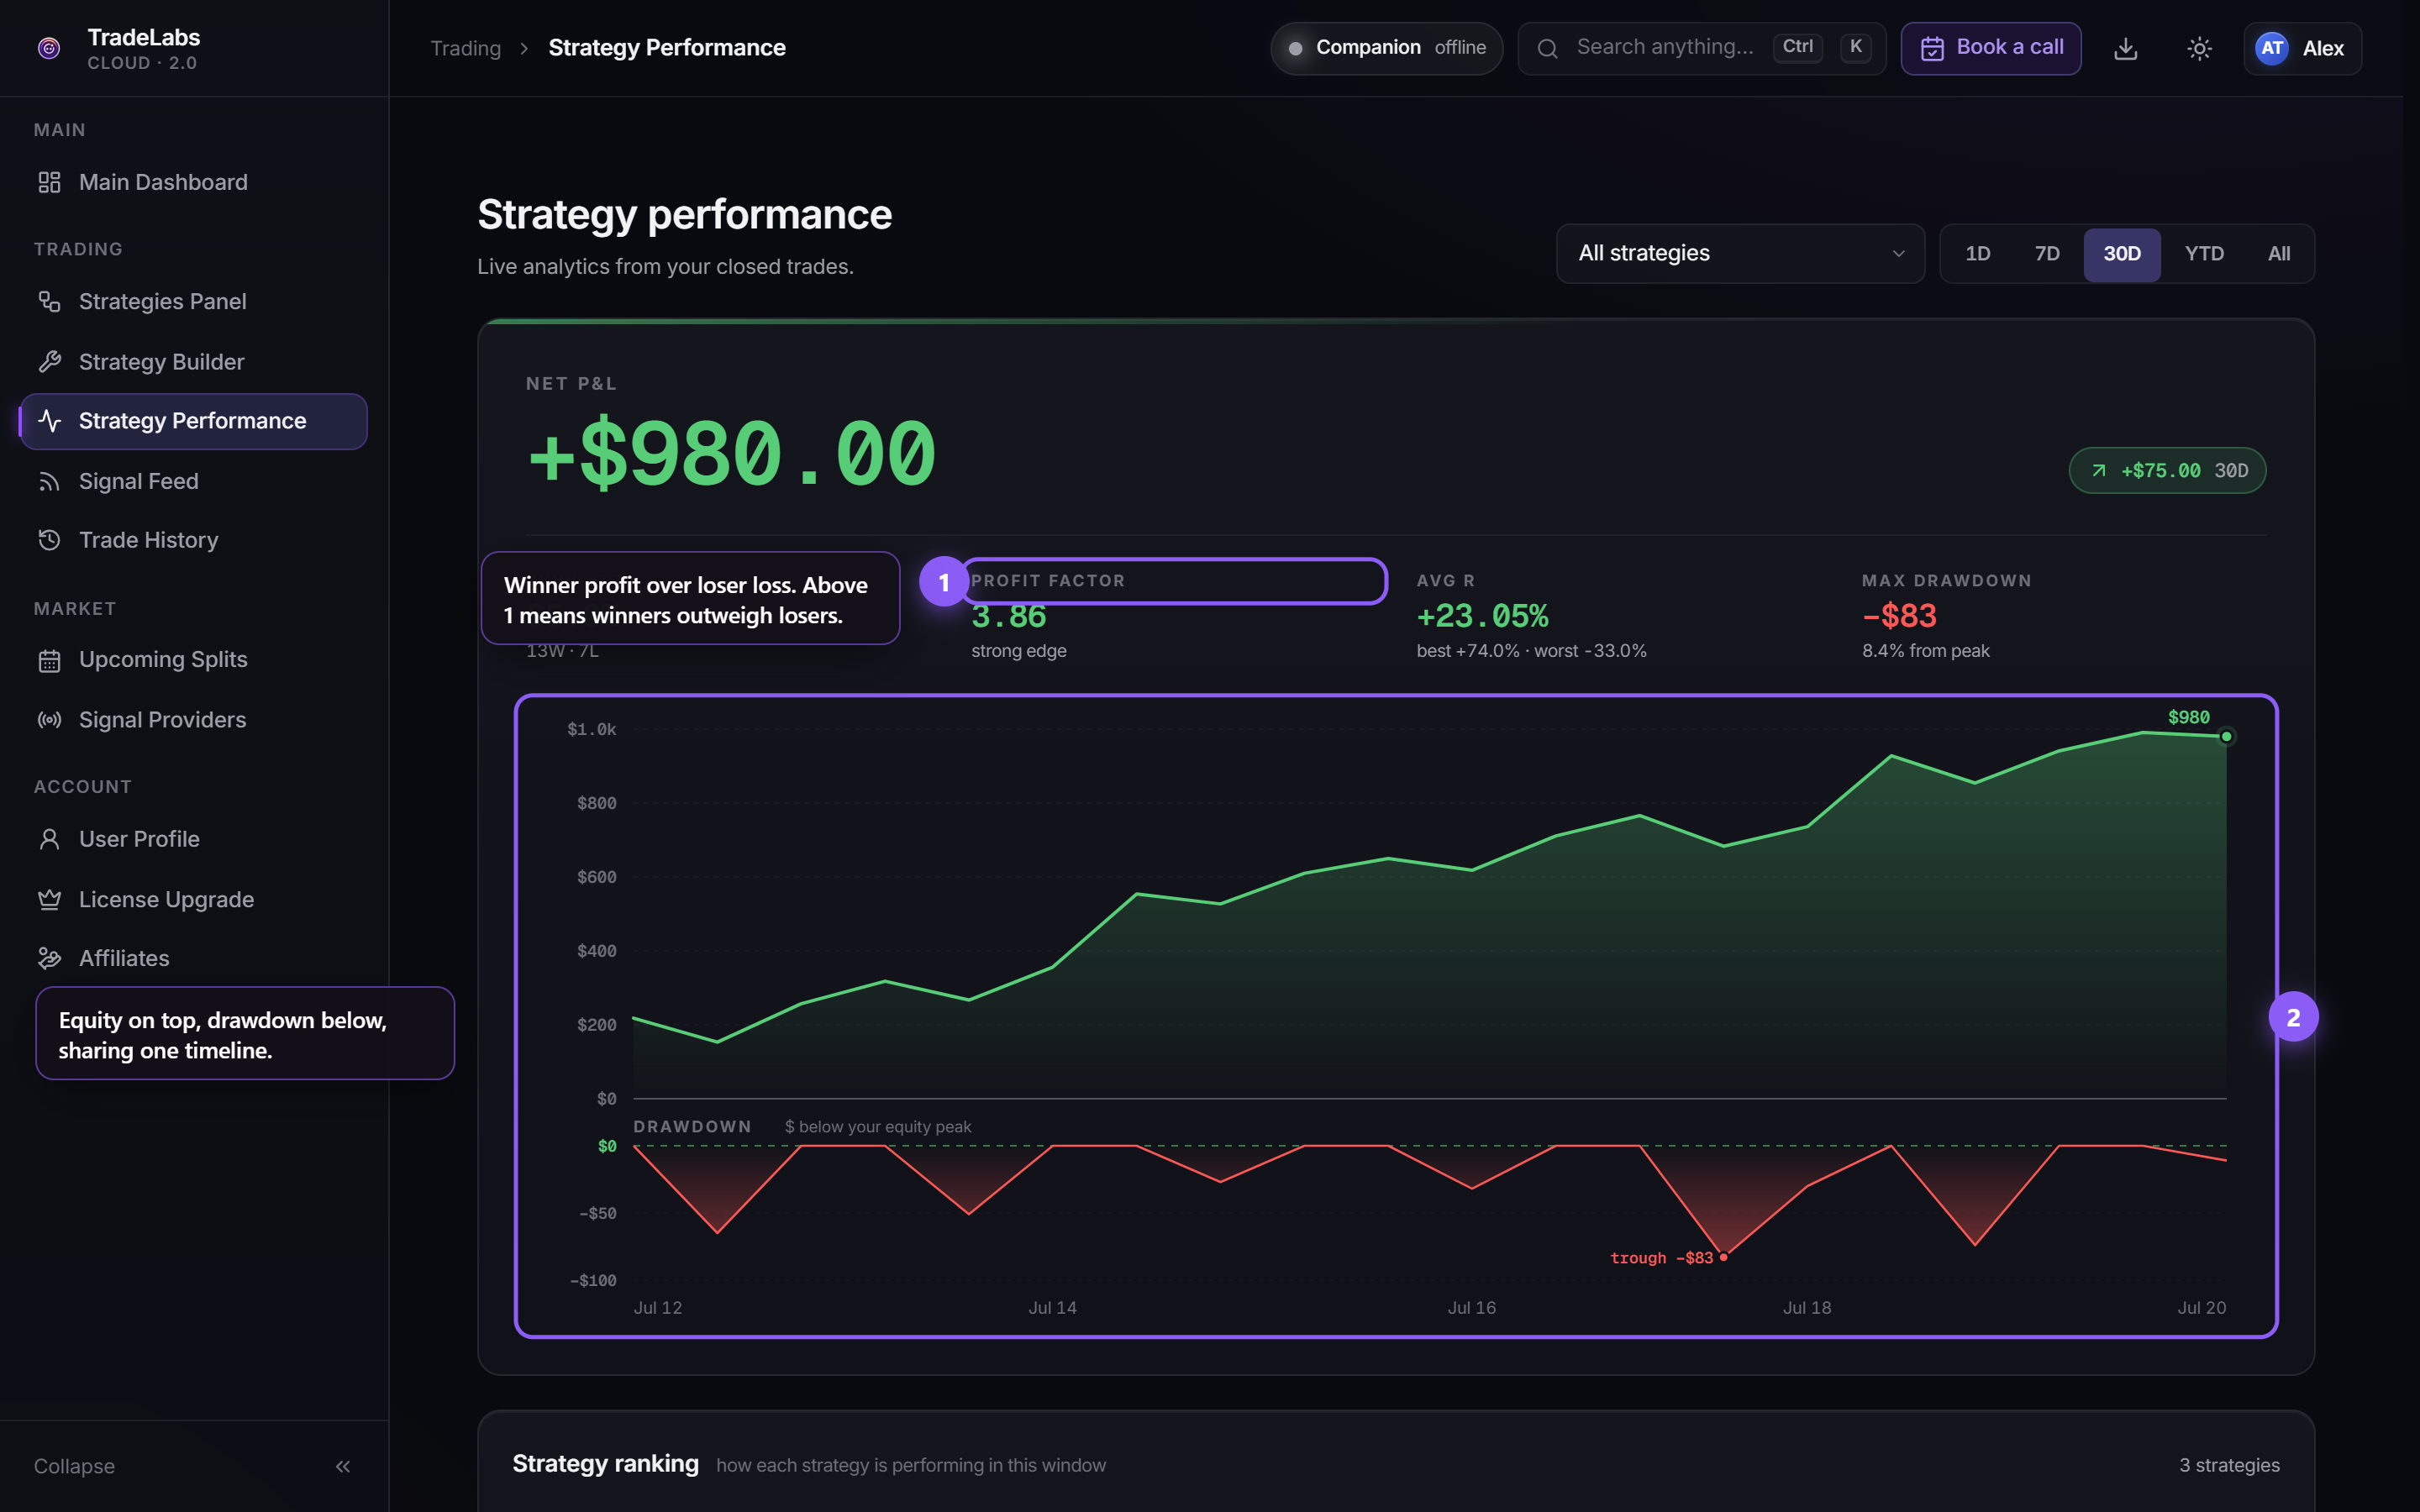 The Strategy Performance page, built entirely from your closed trades.
Main Dashboard is the scorecard. A large Net P&L sits up top, with 1D, 7D, 30D, YTD and ALL tabs that move every figure on the page. Beside it: a delta against the prior period, closed trades, win rate, profit factor, strategy count, and best, worst and average trade.
An equity curve plots running P&L. Below it sit Top strategies ranked by net P&L, Recent activity, a P&L calendar, and a P&L contribution strip.
Strategy Performance is the deeper view, with a strategy dropdown and a range toggle.
| Metric | What it means |
|---|---|
| Net P&L | Profit or loss in the window, with a delta against the prior period. |
| Win rate | Share of closed trades that made money, with a W/L count. |
| Profit factor | Winner profit divided by loser loss. Above 1 means winners outweigh losers. Shows ∞ with winners and no losers. |
| Avg R | Average result per trade, as a percentage. |
| Max drawdown | Largest drop from a peak in the window, in dollars, with the percentage from that peak. |
A stacked equity and drawdown chart shares one timeline and marks the deepest trough. Under it, a sortable table ranks every strategy that traded, and a filterable trade history closes the page.
Signal feed
The Signal Feed is the raw stream of alerts your sources produced, before any strategy decided what to do with them. Each row is one alert: side glyph, ticker, bias, channel, message, timestamp. An insight rail beside it carries whole-feed stats.
Filter by side, by matched or unmatched, and by channel, then search the text. The list pages rather than scrolling forever. The rail’s numbers cover your entire history, not just the loaded page.
Use it to answer “did the alert even arrive?” The Companion App’s Activity feed answers the next question, “and what did we do with it?”
Trade history
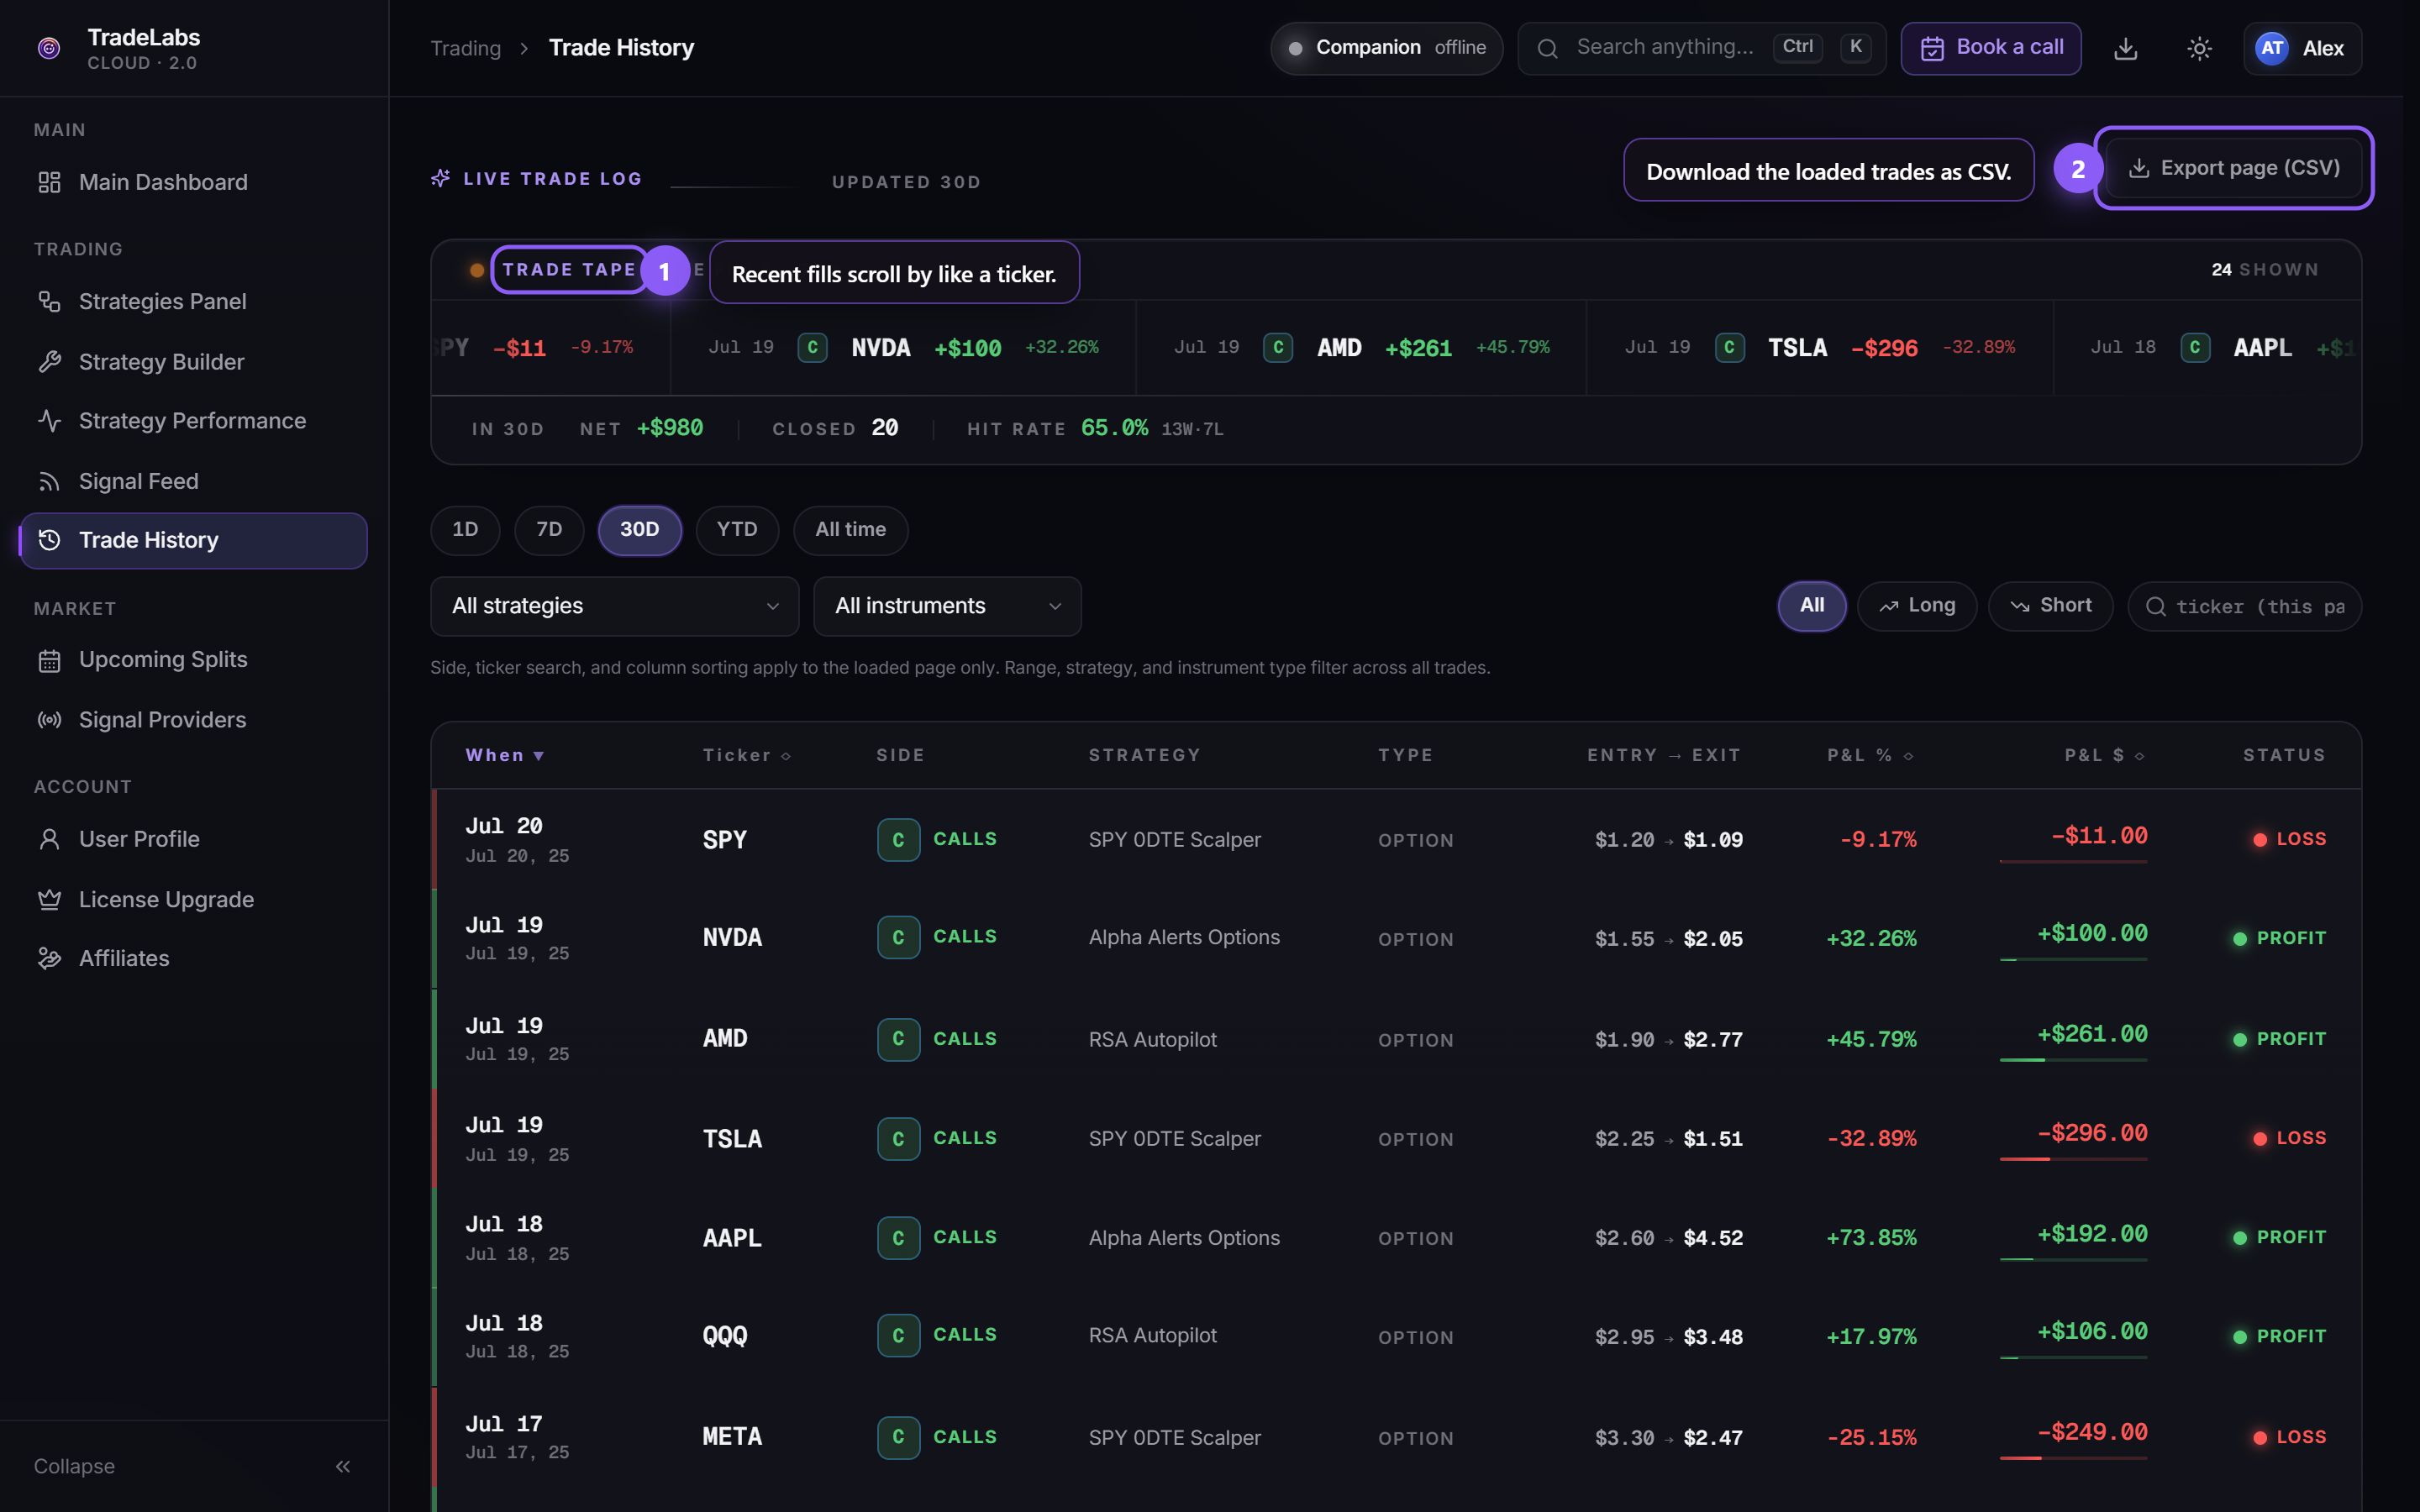 The Trade History page: every closed trade, filterable and exportable to CSV.
Every trade your strategies have run. A trade tape scrolls recent closed fills like a ticker; hover to pause it. A caption strip carries the window’s Net, Closed count, and Hit rate.
Filters work at two scopes, and the page tells you which is which:
- All your trades: time range, strategy, and instrument type (Stocks, Options, Crypto, Spreads, Memecoins, Prediction).
- The loaded page only: side, ticker search, and column sorting.
Columns are When, Ticker, Side, Strategy, Type, Entry to Exit, P&L %, P&L $, and Status. Side reads in the instrument’s own language: Long and Short for stocks, Calls and Puts for options, Yes and No for prediction markets.
Export page (CSV) downloads the trades currently loaded, not your whole history. To export more, page through or widen the filters first.
Signal providers
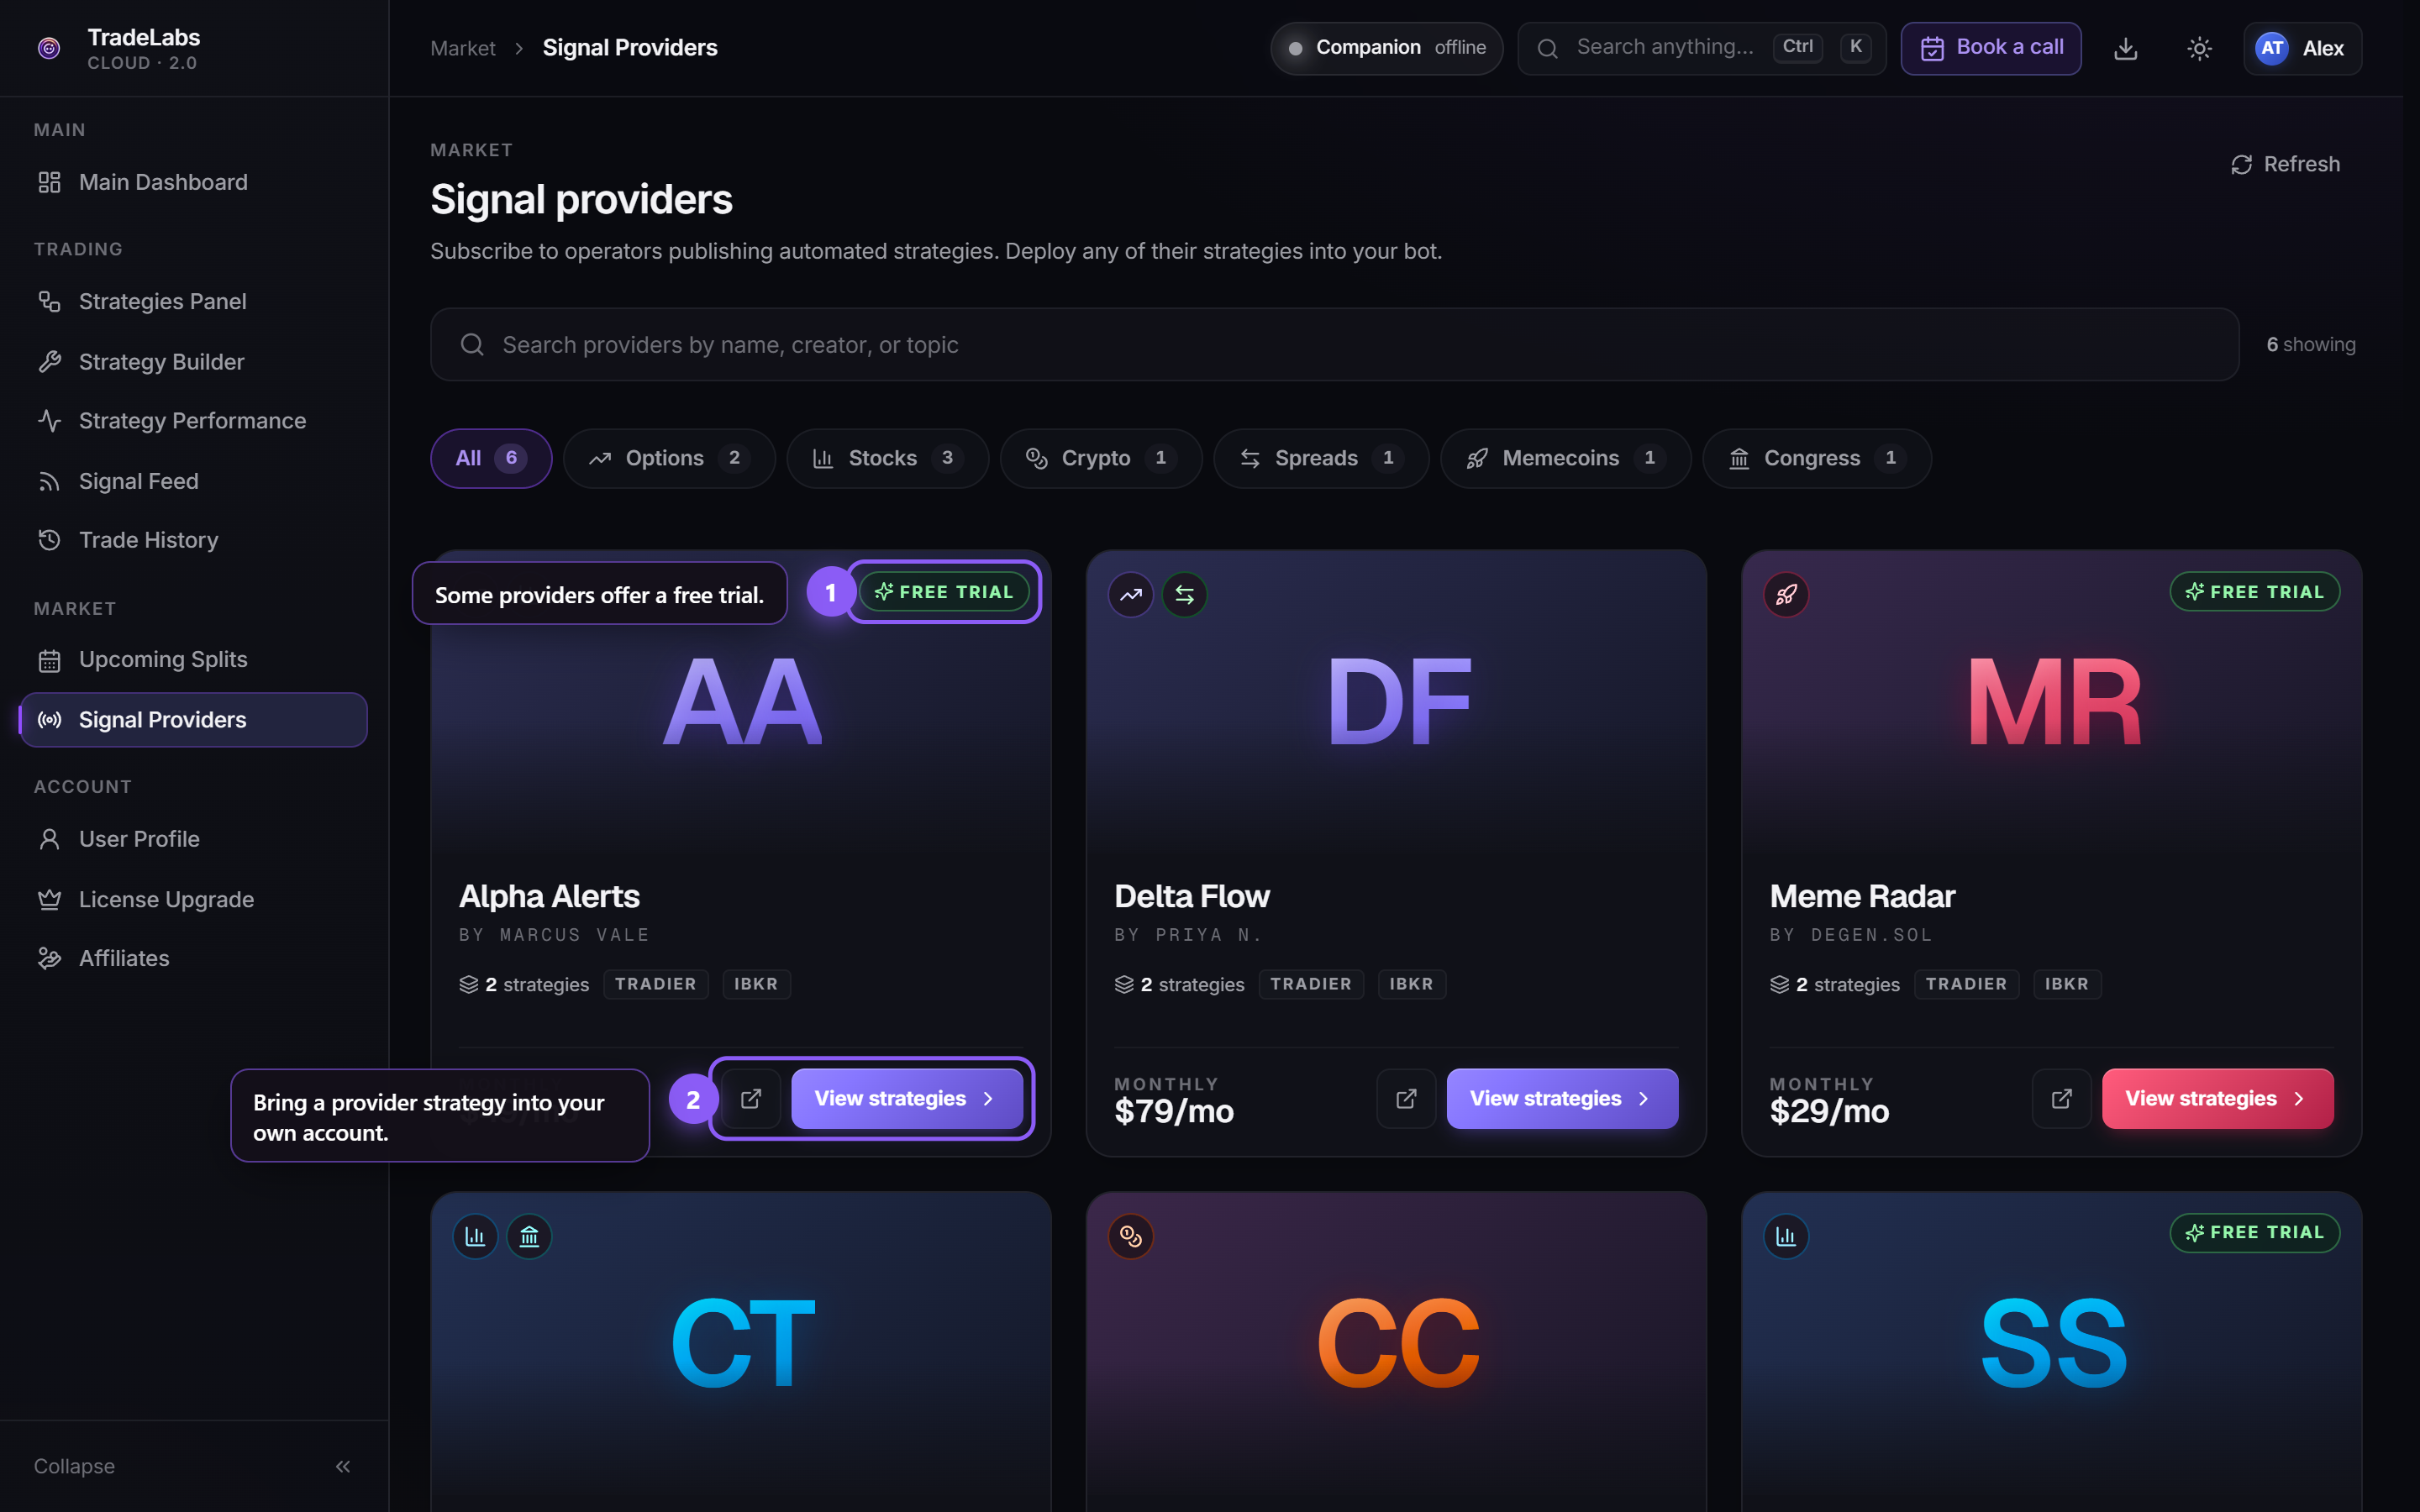 The Signal Providers marketplace.
A marketplace of operators who publish automated strategies. Category tabs filter by asset class, and search matches a provider’s name, creator, or topic. Each tile shows the provider, their asset classes, the brokers their strategies route through, a monthly price, and a free-trial badge when one is offered.
View strategies lists what a provider publishes. Import copies a strategy into your account, where it lands paused. Providers are paid operators, so Subscribe on provider site opens their own page. Alerts only fire once you hold their subscription and have their channel connected.
A provider’s strategy is a starting point, not a finished setup. Set your own position size, pick a broker you have connected, and set stop-loss and take-profit levels that match your risk.
Upcoming splits (RSA+)
Upcoming Splits is RSA+ only. Other plans see an upgrade prompt.
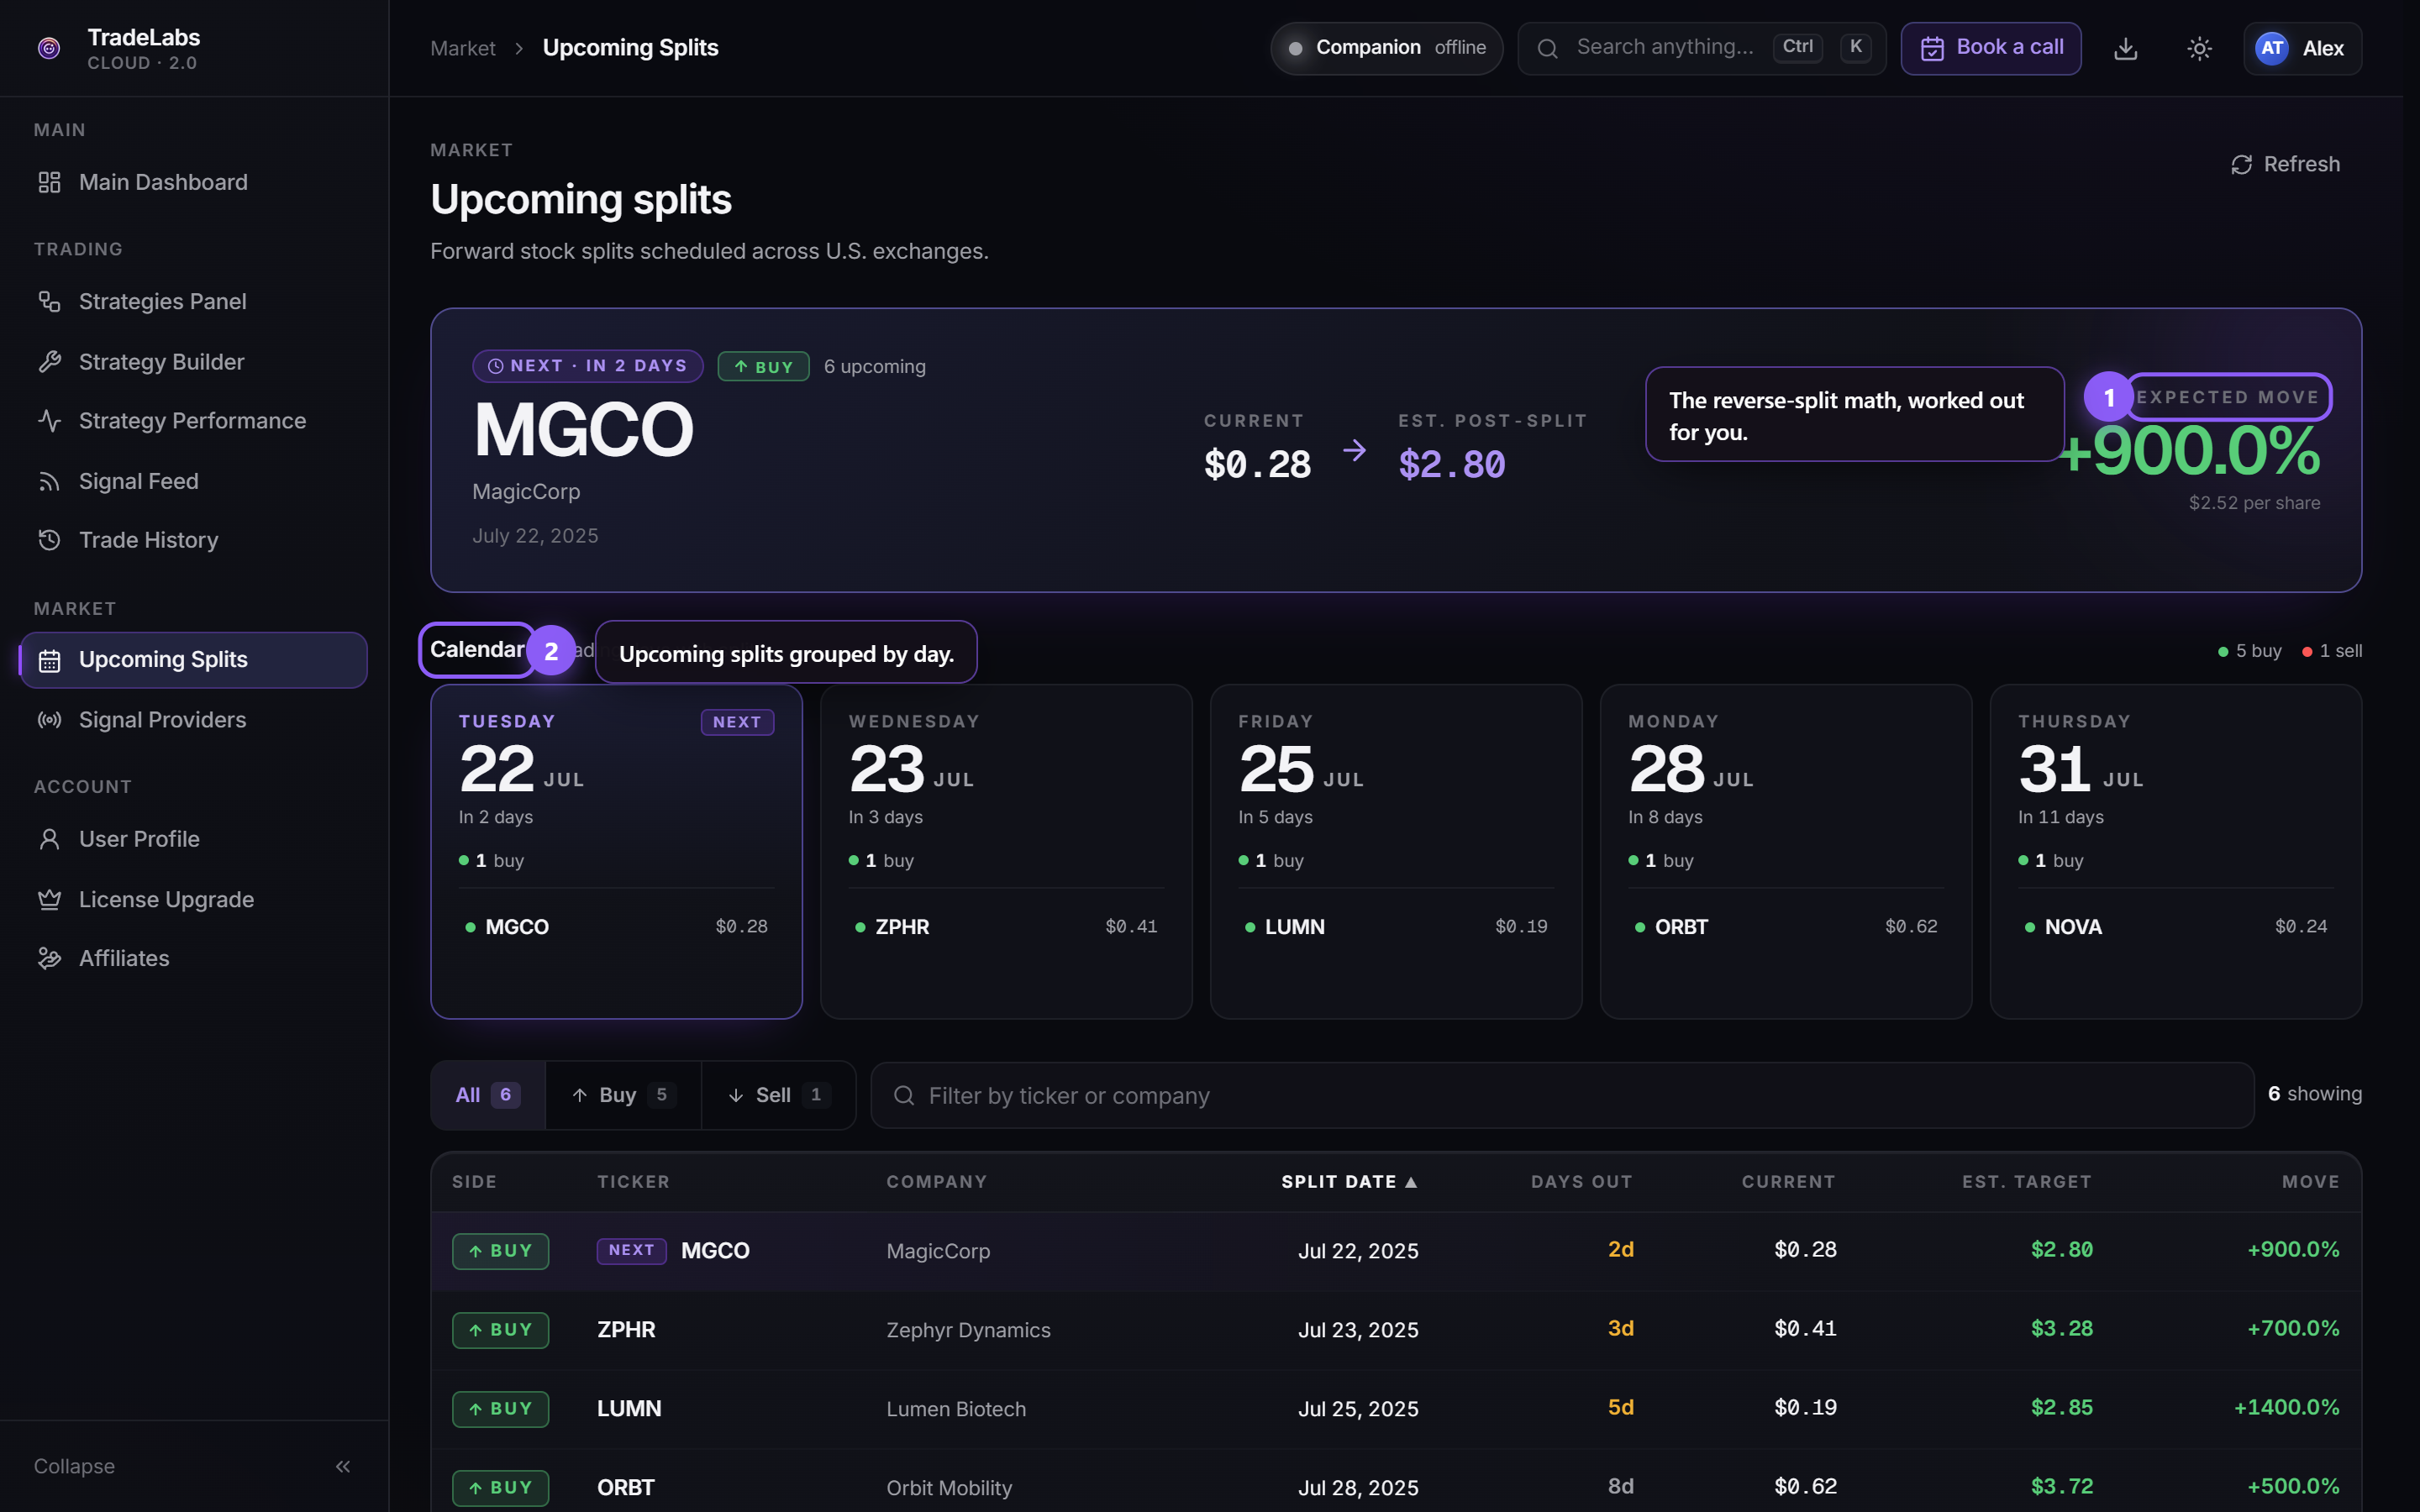 The Upcoming Splits calendar (RSA+), with the reverse-split price math worked out.
A live calendar of forward stock splits scheduled across U.S. exchanges, with the price math already worked out for reverse-split arbitrage. A hero card surfaces the soonest split with a countdown and the current to estimated post-split price. Below it, day cards group splits by date, and a sortable table lists the full set with All, Buy and Sell chips, search, and refresh.
The table columns are Side, Ticker, Company, Split date, Days out, Current price, Est. target, and Move.
A Sell row is a “collect now” instruction for a stock that has already rounded up. It has no future date, target, or move, so those cells read as a dash and Move shows a Collect tag.
This page only shows the opportunities. An RSA strategy in your Companion App does the buying and selling. See RSA+ Trading.
Affiliates
Your referral link sits at the top; click to copy it. A stats strip carries lifetime and active earnings, active referrals, and conversion rate.
Commission rises with the referrals you bring in:
| Tier | Referrals | Commission |
|---|---|---|
| Newcomer | 0 | 15% |
| Rising Star | 5 | 20% |
| Champion | 10 | 25% |
Redeem applies your confirmed commission as credit against your own subscription. The balance has to reach $20 first.
Campaign links are named links, so you can tell traffic sources apart. An Activity panel at the bottom splits into Referrals and Transactions, with a privacy toggle that blanks the numbers for screen sharing.
Account & billing
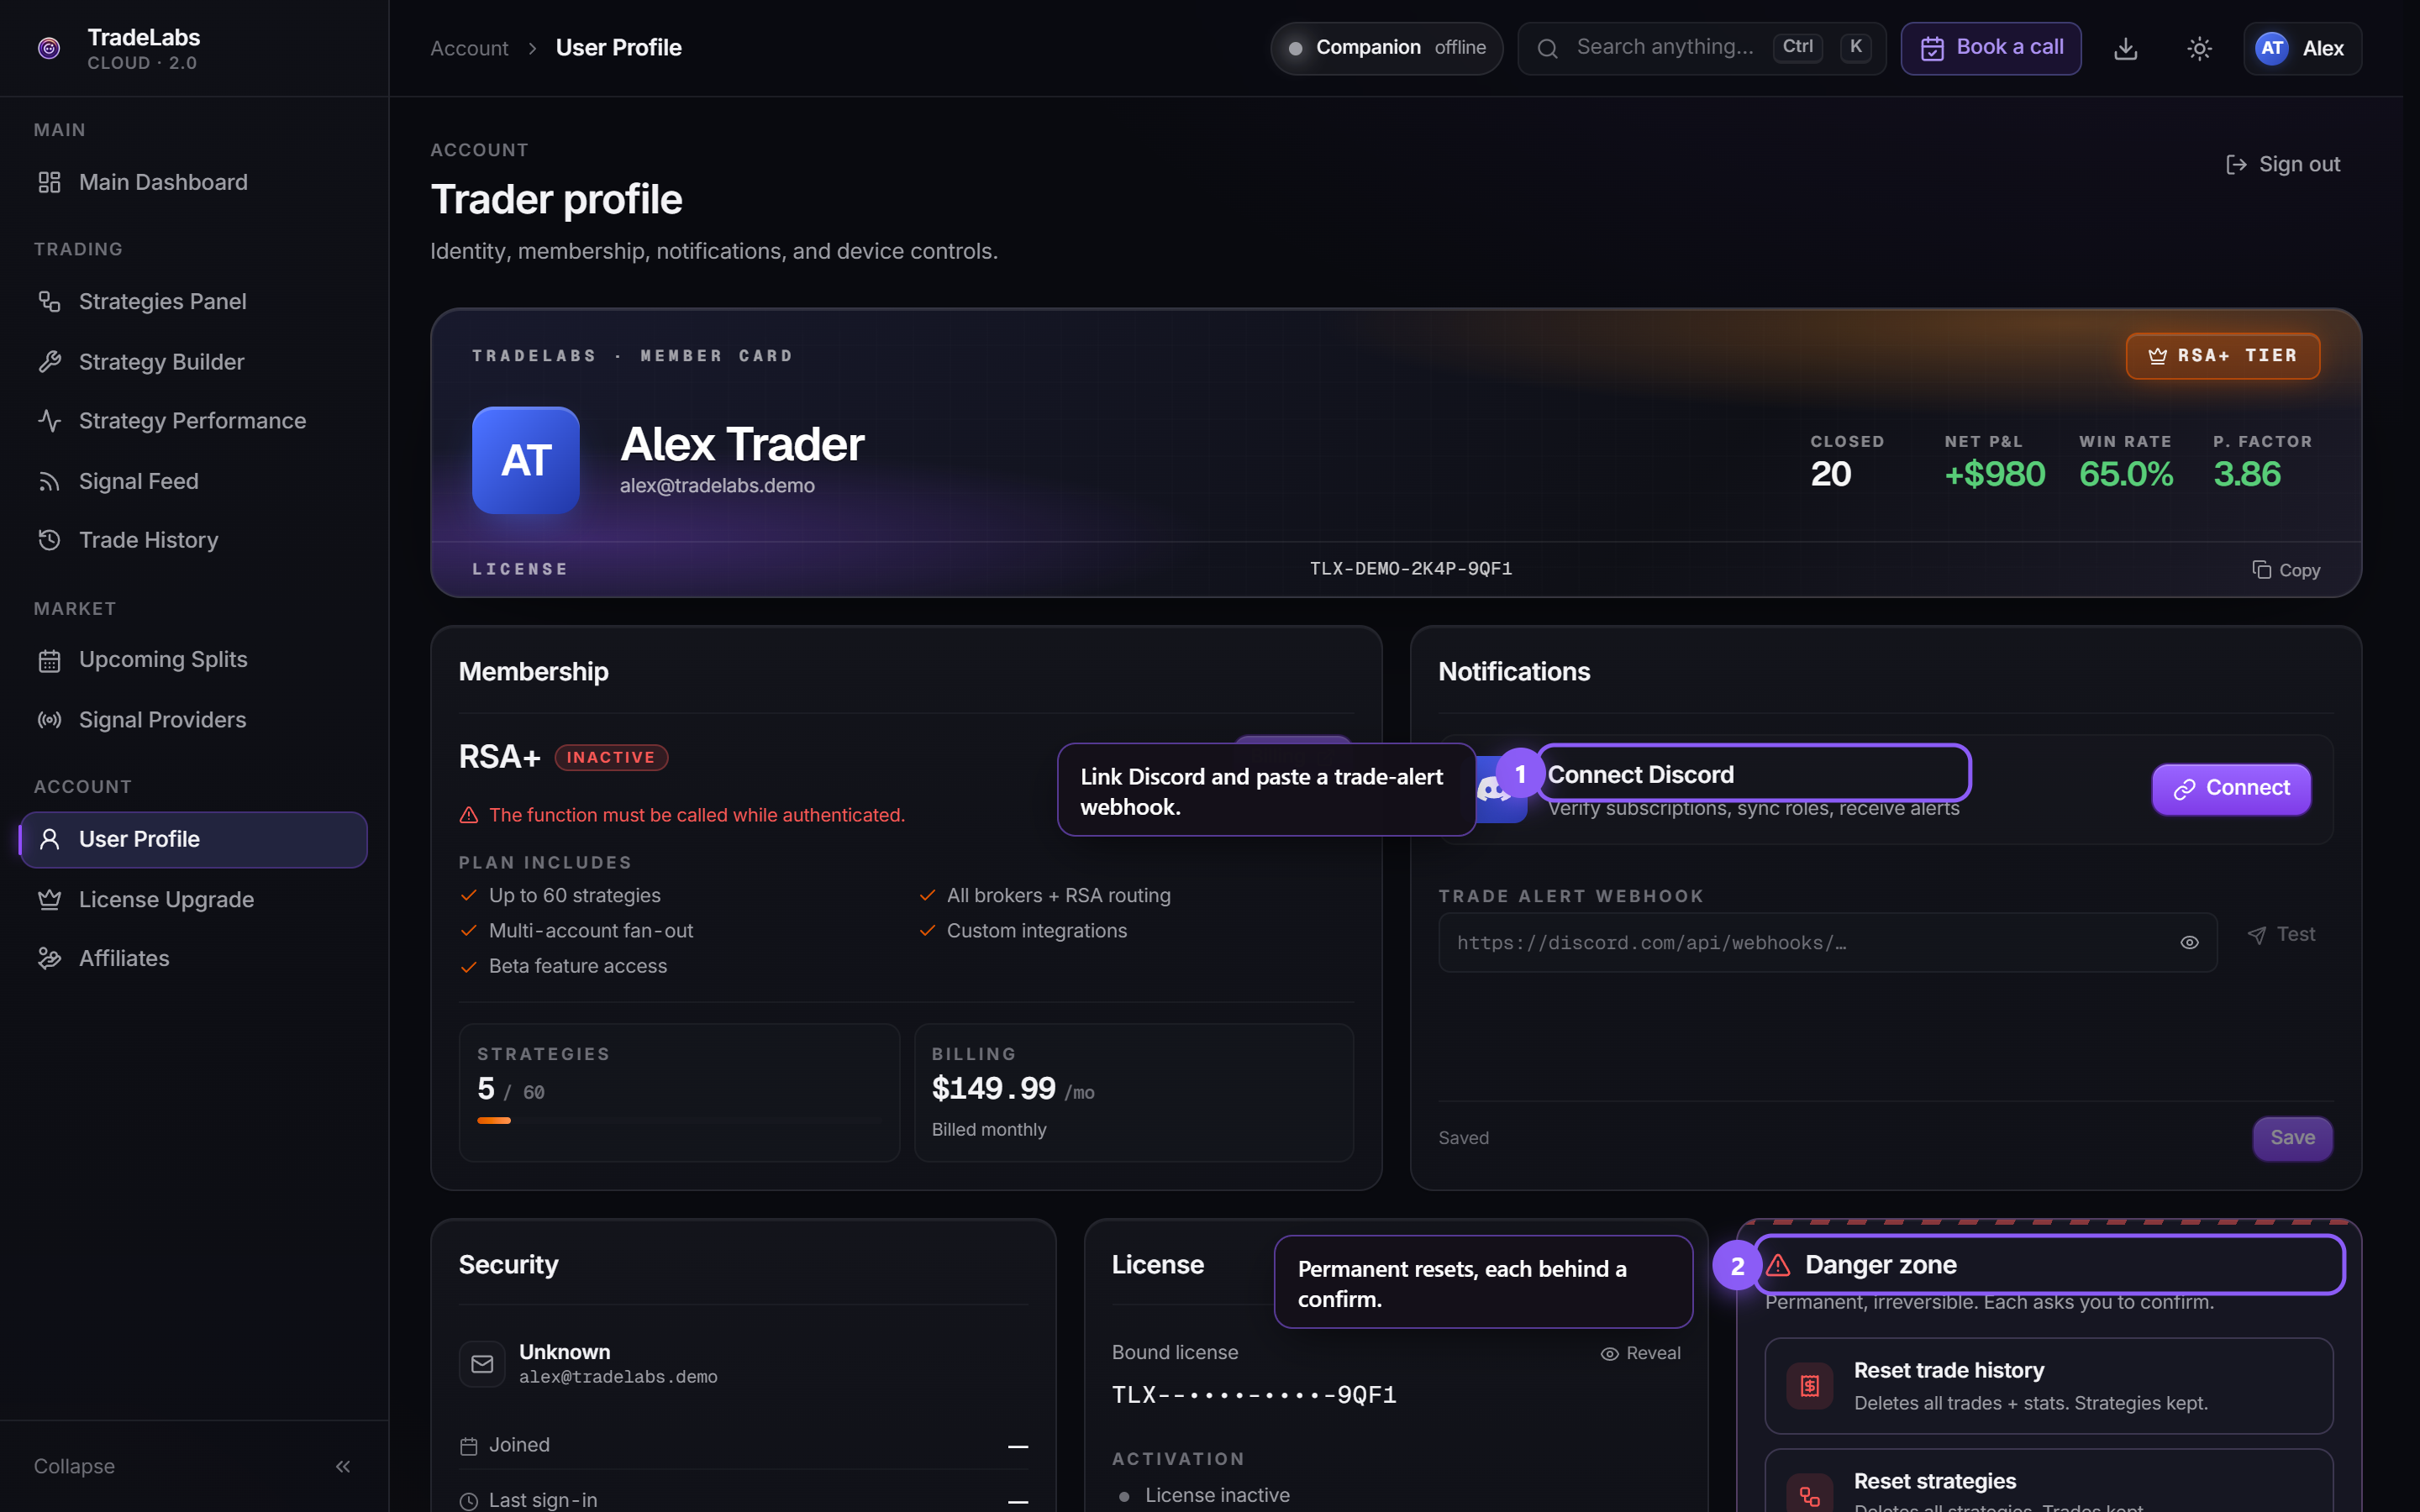 The User Profile page: your plan, license key, and account controls.
Everything about your account lives on the User Profile page. There is no separate Settings page. Sign out is top-right.
A trader card carries your avatar, name, email and tier badge, a lifetime KPI strip, and your license key. The key is tied to your account. Do not share it.
Membership shows your plan, status, renewal or expiry date, strategy usage against your cap, and price. Billing opens the Stripe portal to update payment, view invoices, or cancel.
License Upgrade sells three offers:
| Plan | Monthly | Yearly | Strategies |
|---|---|---|---|
| Trial | Free for 7 days, then $49.99 | 1 | |
| Copy Trading | $49.99 | $479.99 | 20 |
| RSA+ | $149.99 | $1,440 | 60 |
Both paid plans include the copy-trading brokers, curated signal providers, automatic execution, and premium order routing. RSA+ adds every supported broker, reverse split automation, trading across many accounts at once, proxy support, custom integrations, and early access to beta builds.
Switching plans opens the Stripe portal. Your license binds automatically, with no key to paste.
Notifications. Connect links your Discord account, which verifies your subscription and syncs your roles. Paste a Discord webhook URL into Trade alert webhook for alerts in your own channel, with Test, an enable switch, Compact format, and Broker error alerts. Click Save to store changes.
Security shows how you sign in, when you joined, and your last sign-in. Send link emails a password-reset link to email accounts.
License and device. The License panel reveals your key, runs an activation checklist, offers Download Companion, and holds Reset hardware binding. Your license binds to one computer at a time. To move machines, reset the binding, confirm, then sign in on the new one.
The Danger zone holds three permanent resets, each confirmed before it runs: Reset trade history (deletes trades and stats, keeps strategies), Reset strategies (deletes strategies, keeps history), and Reset entire account (erases everything, no recovery).