Using the App
Overview
The Overview page is your mission control: realized P&L, live strategy activity, broker sessions, signal sources, and a live event log, all on one screen.
Overview is the default landing page. It is your mission control: one screen that answers “is my bot working right now?” without digging through logs. It is a grid of widgets, so the exact layout depends on what you have turned on, but every widget below ships on by default.
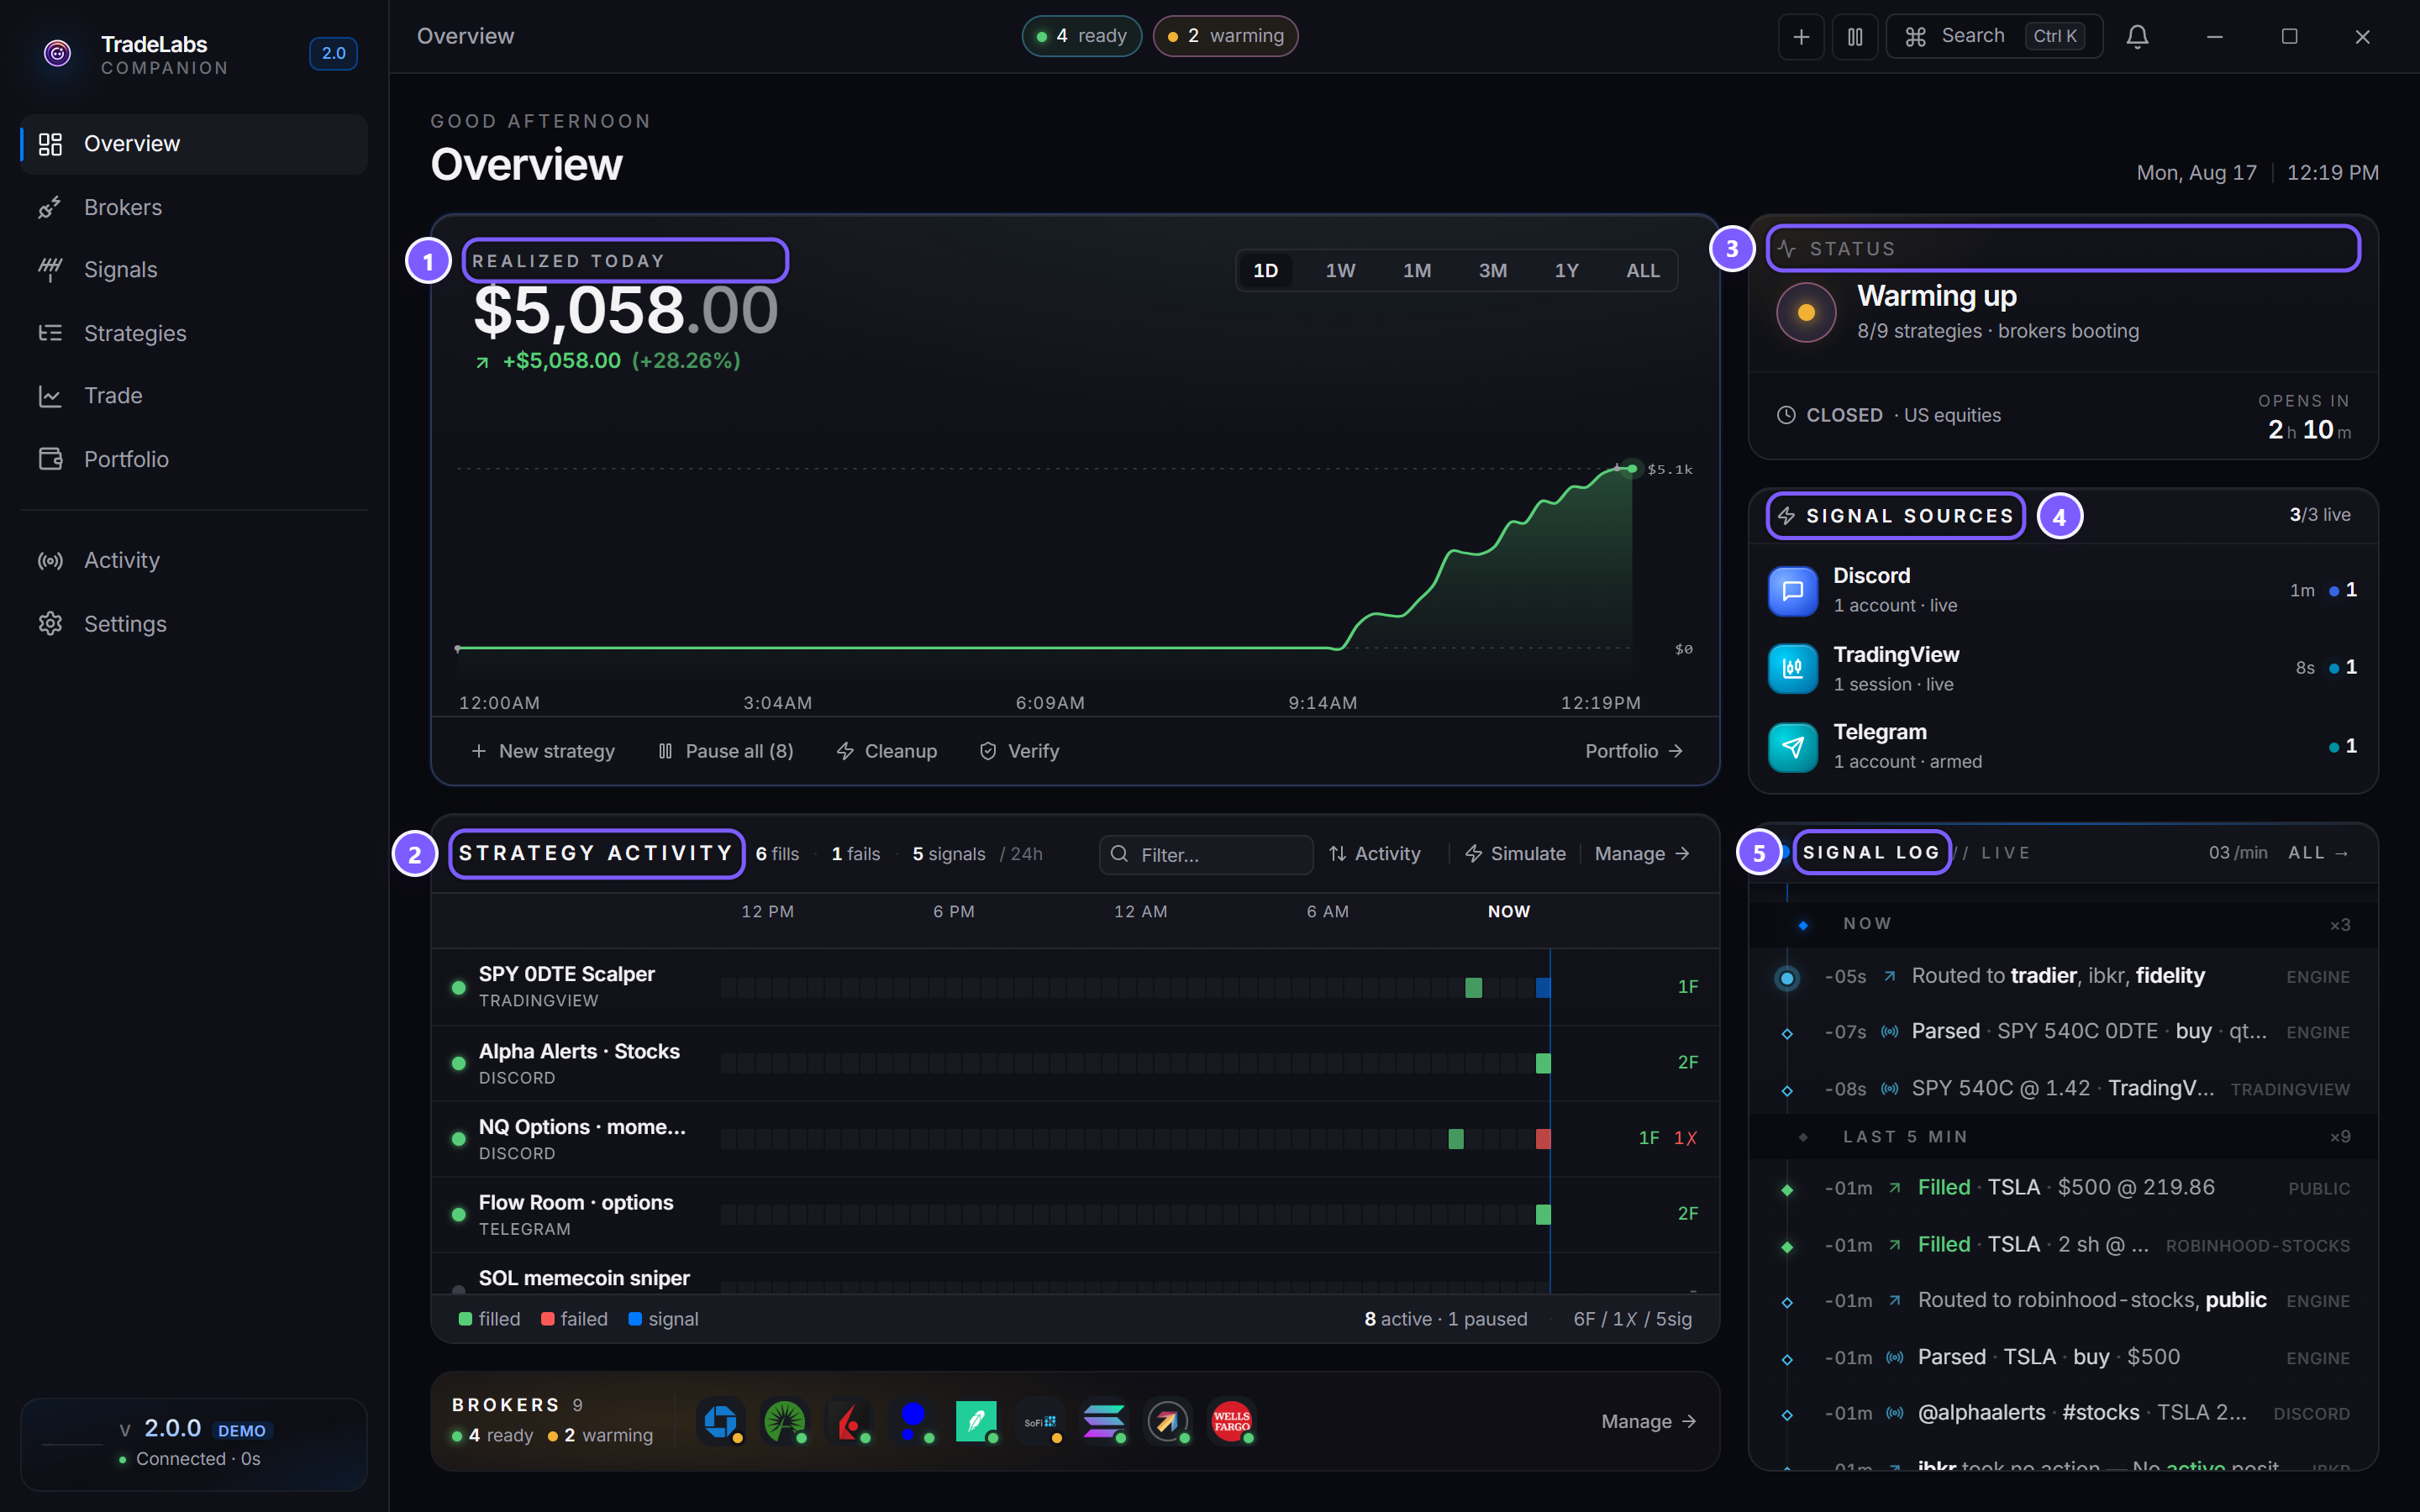
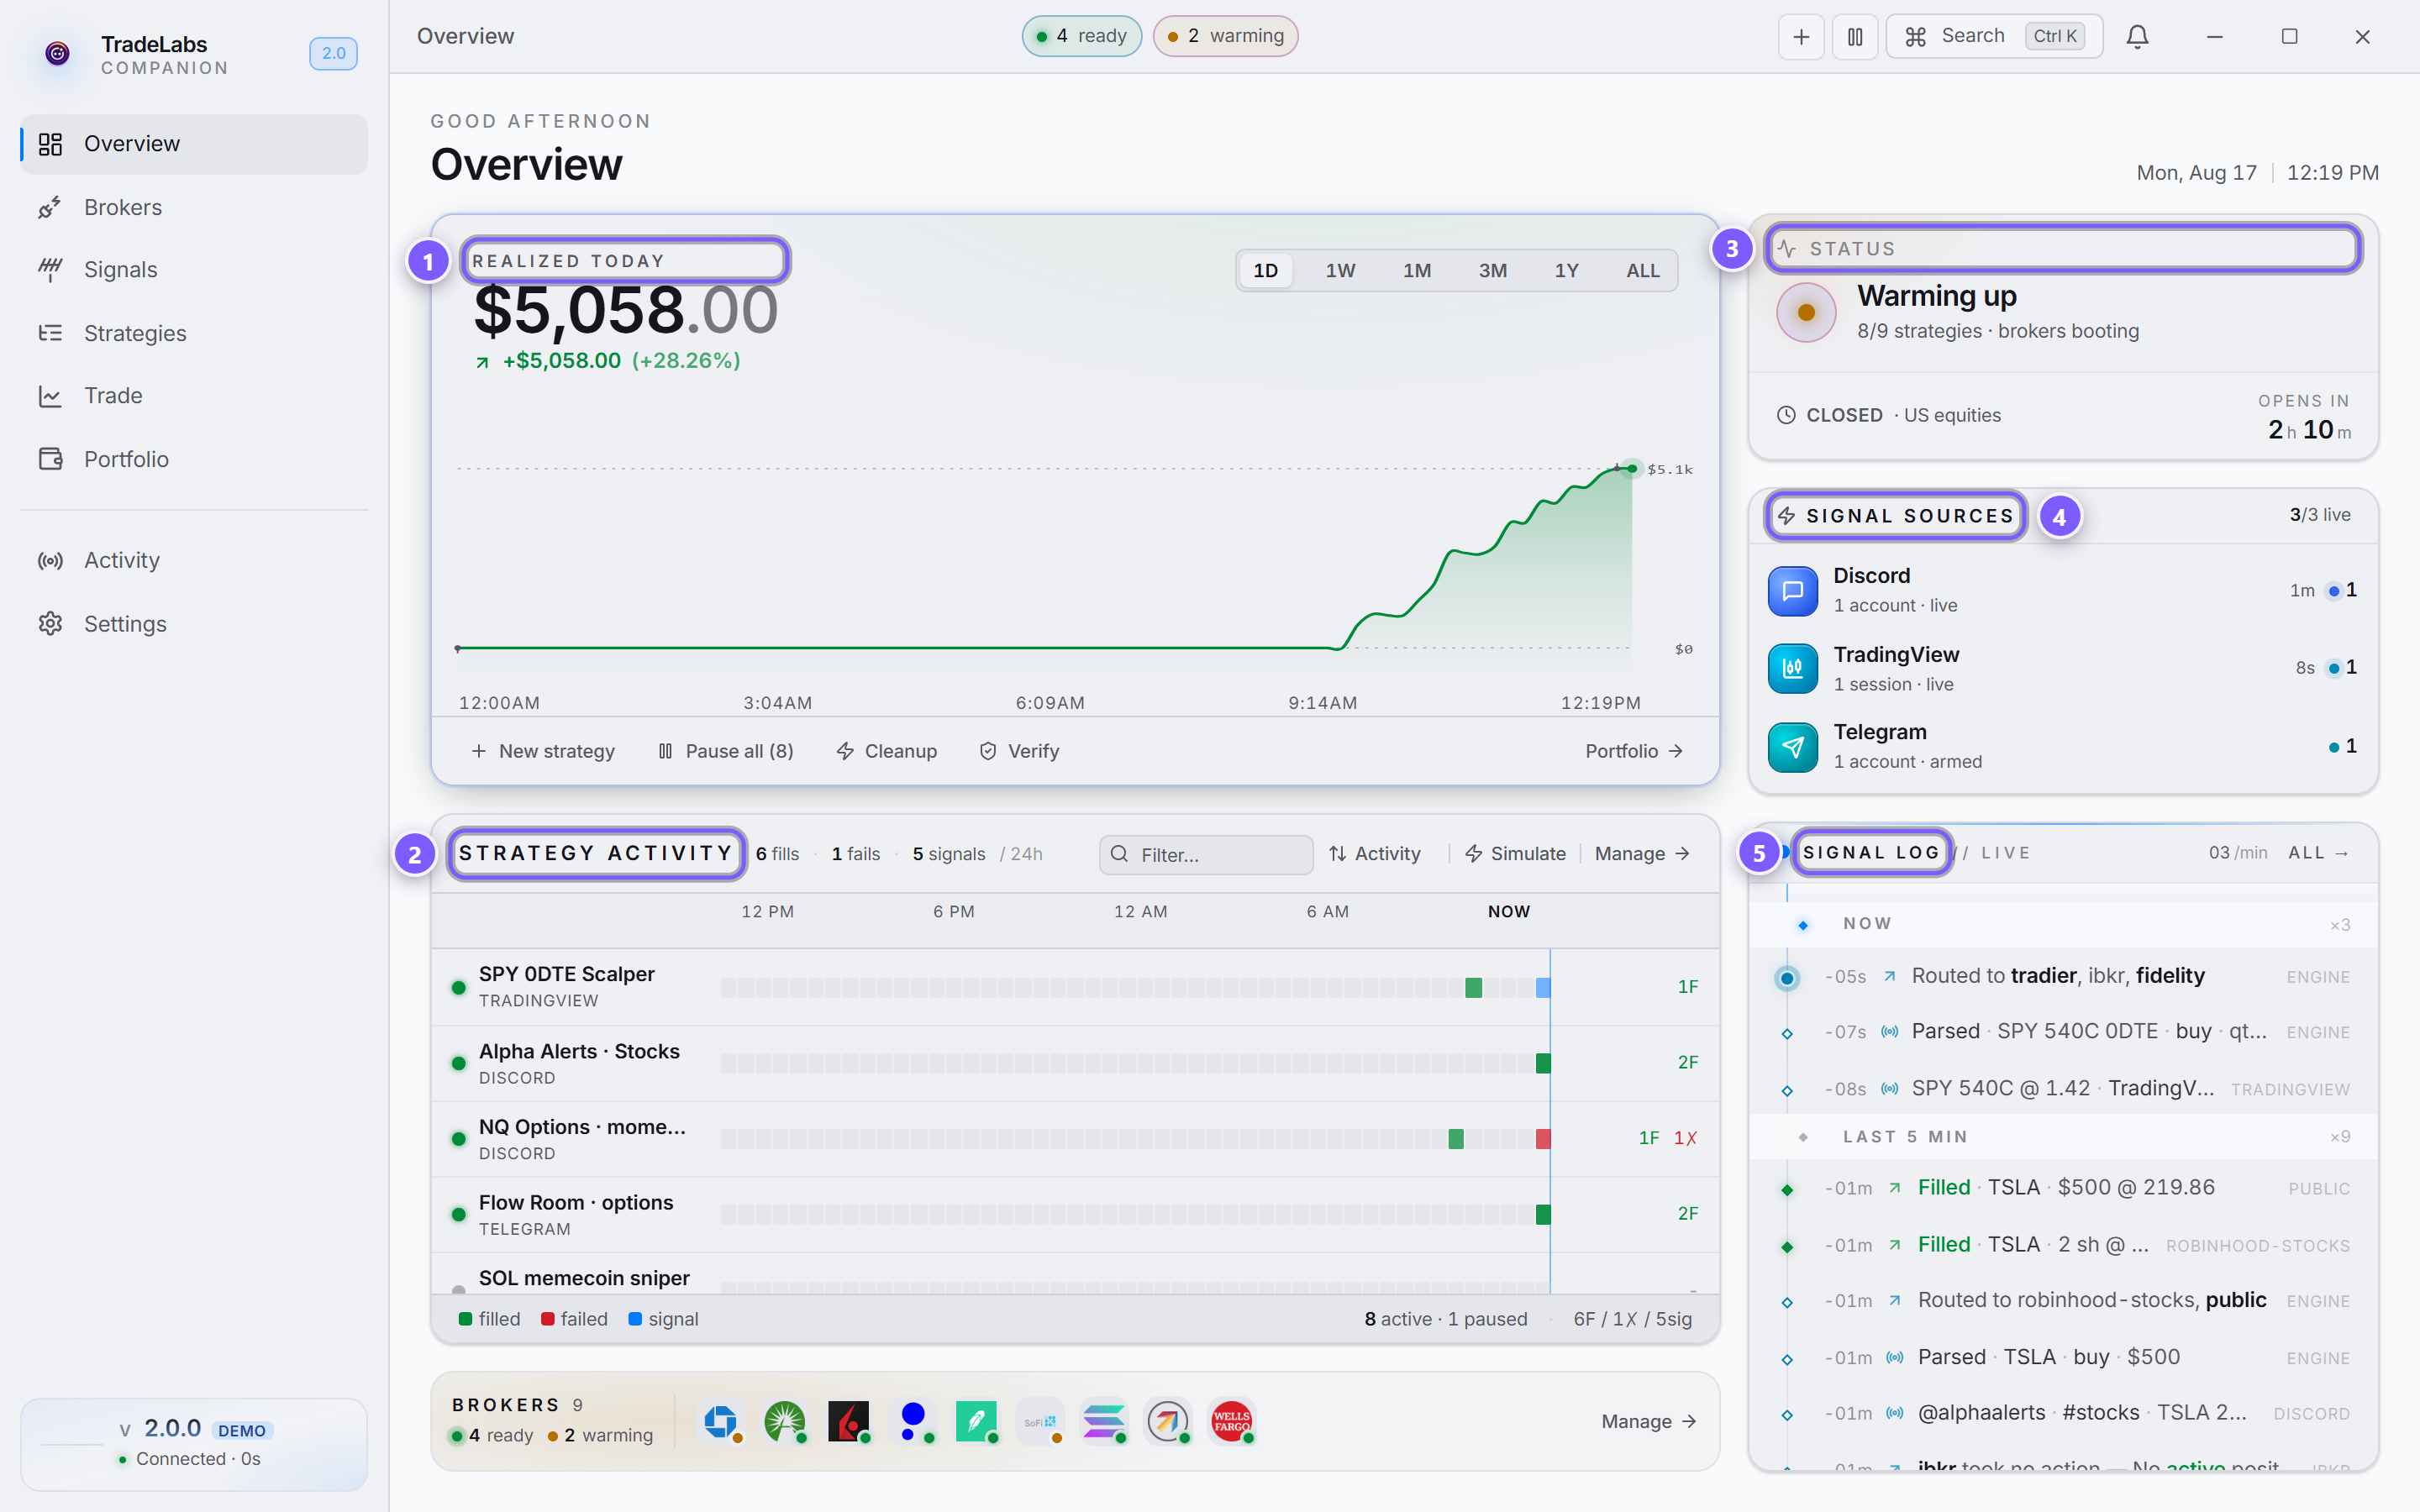
- P&L hero — realized profit and loss over the range you pick, with the chart under it.
- Strategy Activity — every strategy and the fills, misses, and signals it has had.
- Status — the one-line answer to "is my bot working right now?"
- Signal Sources — which of your sources are connected and listening.
- Signal Log — every signal and fill, live, as it happens.
The header greets you by time of day (Good morning, Good afternoon, Good evening, or Late night) and shows the current date and clock.
If a broker keeps crashing, a red banner appears at the top of Overview with a title like keeps crashing. Auto-restart paused. Use Open Brokers on the banner to jump straight to the broker, or open the logs.
The widgets
P&L hero
The large panel shows your realized profit and loss. The heading reads Realized today on the day range, or Realized with the range name otherwise. Before your first trade of the day it says Waiting for today’s first trade.
Pick a time range with the tabs in the top right: 1D, 1W, 1M, 3M, 1Y, ALL. Hover the chart to scrub a value pill along the curve.
The footer is a row of quick actions:
| Button | What it does |
|---|---|
| New strategy | Opens the Strategies page |
| Pause all / Resume all | Toggles every strategy at once. The label shows the running count, for example Pause all (3) |
| Cleanup | Opens the Portfolio page |
| Verify | Re-checks every connected broker session |
| Portfolio | Jumps to the Portfolio page |
Verify confirms your broker sessions are still good. When it finishes you see a Verified toast with the count. It is the fastest way to check every account before market open.
Strategy Activity
Titled Strategy Activity, this is a 24-hour heatmap with one row per strategy. Each row is a strip of colored cells: filled (green), failed (red), and signal (blue), summed into totals per day. A vertical now line marks the current time on the right edge.
Controls in the header:
- A Filter box to narrow the list by strategy name.
- A sort toggle that switches between Activity and Name.
- Simulate to send a test signal through a strategy.
- Manage to open the Strategies page.
Each row has a status dot: Paused, In flight, Active in last hour, or Idle. Click a row to open that strategy. With no strategies yet, the panel shows No strategies yet and a Create a strategy button.
Broker sessions
A compact dock of every broker, labeled Brokers. It rolls up your broker health into counts: ready, warming, and offline. Active and idle brokers both count as ready, so a broker sitting idle overnight is not a problem.
Each broker shows as a logo tile with a single corner dot for its state. Hover a tile to see the broker name, its state, and when it was last verified. Click any tile, or Manage, to open the Brokers page. If nothing is set up yet it reads No sessions yet with an Add broker button.
Broker health has four states: Active, Idle, Warming, and Offline. Idle at night is normal. A chrome-based broker booting up shows as Warming. See Broker status for the full breakdown.
Status
A small rail card titled Status. It summarizes your strategies and the market clock in one place:
- A headline like 3 running, All paused, Warming up, Attention needed, or Not configured, with the running count out of your total.
- A market clock showing Open or Closed for US equities, plus Closes in or Opens in and a countdown.
Signal Sources
Titled Signal Sources, this rail card lists each source you can connect: Discord, TradingView, and Telegram. The header shows how many are live.
Each row shows the source, a sub-line of its state (Not connected, Authenticated, or a count of accounts or sessions with live or armed), and the time since its last signal. Click a row to open that source’s page, or use the Connect action on a source that is not set up yet.
Serverside signals are auto-on for RSA strategies and are not picked in the signal hub, so they do not appear as a row here.
Signal Log
Titled Signal Log, this is the live event feed, the same data the Activity page shows in full. Every signal, fill, and error lands here newest-first, grouped into buckets like Now, Last 5 min, Past hour, Earlier today, and Older. The header shows a per-minute rate and, when there is history, an All link to the Activity page.
When nothing has happened yet it shows Awaiting Signal with the note The log lights up the moment your bot moves.
Rearranging the layout
The widgets and their two columns are yours to arrange. Open Settings, then the Customization tab, to toggle widgets on or off and move them between columns. If a column is empty, Overview tells you so and points you back to Settings, then Customization.